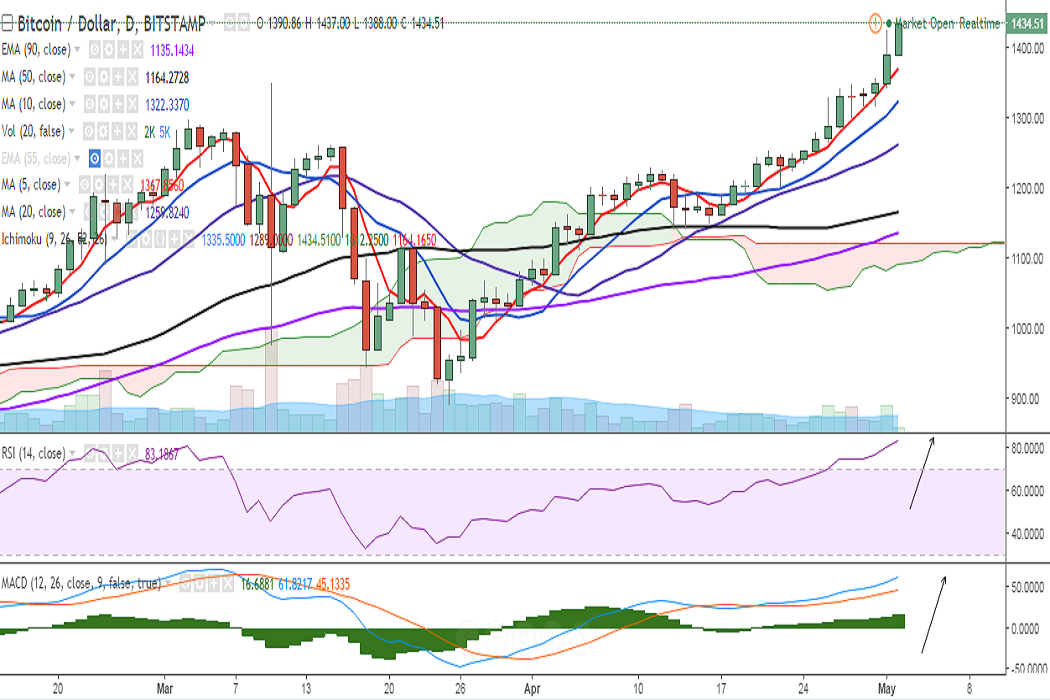
BTC/USD hit 1425 levels on Monday, before closing at 1390.86. It is trading higher on Tuesday at 1436 levels at the time of writing (Bitstamp).
Ichimoku analysis of daily chart:
Tenkan Sen: 1335.50
Kijun Sen: 1289
Momentum studies appear highly bullish with MACD line above the signal line, RSI strong at 83, and major moving averages pointing north. However, caution is advised as stochs are in the overbought zone.
On the upside, the pair has broken above 1427 (113% extension of 751.34 and 1350) and a close above would see a jump till 1474 (127.2% retracement of 1350 and 891.33)/1500.
On the downside, support is seen at 1368 (5-DMA) and any violation would see a dip till 1322 (10-DMA)/1259.69 (20-DMA).