


 BTC’s Bear Bounce: Sell the Rally Near $66K as Bears Target $59K–$52K Breakdown
  FxWirePro- Major Crypto levels and bias summary
  Ethereum Cracks Under $1,700: Sell the Rally Near $1,750 as Bears Eye $1,380–$1,200
  FxWirePro- Major Crypto levels and bias summary
  FxWirePro- Major Crypto levels and bias summary
  FxWirePro- Major Crypto levels and bias summary


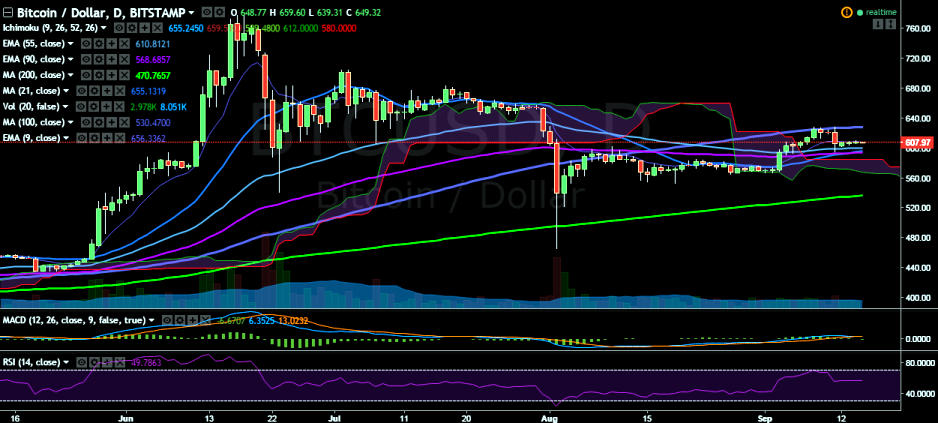
BTC/USD continues to trade flat, unable to break above 9-EMA. The pair is currently trading at 606.81 levels at the time of writing (Bitstamp).
Ichimoku analysis of daily chart:
Tenkan Sen: 611
Kijun Sen: 596.90
Trend reversal: 593.33 (90 EMA)
Major resistance is seen at 627.33 (100-day) and any violation would target 653.69 (78.6% retracement of 704.99 and 465.28)/ 705 (July 3 high). Only a break above the previous high of 628.99 would see further bullishness in the pair.
On the reverse side, the psychological level of 600 is acting as a major support for the pair. Any weakness below this level would see it falling to 593.33 (90 EMA)/ 547.14 (50% retracement of 465.28 and 628.99)/ 535.75 (200-day MA).

- News

- Economy

- Central Banks
- Investing
- Research
- Roundups
- Digital Currency
- Insights
- Technical Analysis
- Technology
- Business
- Law
- Health
- Nature
- Fintech
- Science
- Topic
- Opinions
- ©Econometrics LLC . All Rights Reserved.
FxWirePro: BTC/USD trades rangebound, good to sell on rallies
Thursday, September 15, 2016 7:12 AM UTC
Editor's Picks


- Market Data
Most Popular


