FxWirePro: BTC/USD upside capped by 9-day MA, good to sell on rallies
BTC/USD is trading in a narrow range between $579.80 and $566 for the past three trading session.It is currently trading at $570.97 (Bitstamp). Long-term trend: bullish Ichimoku analysis (Daily chart): Tenkan-Sen level: …
By Shampa Mani
Updated 1 min read
Image from the original EconoTimes article
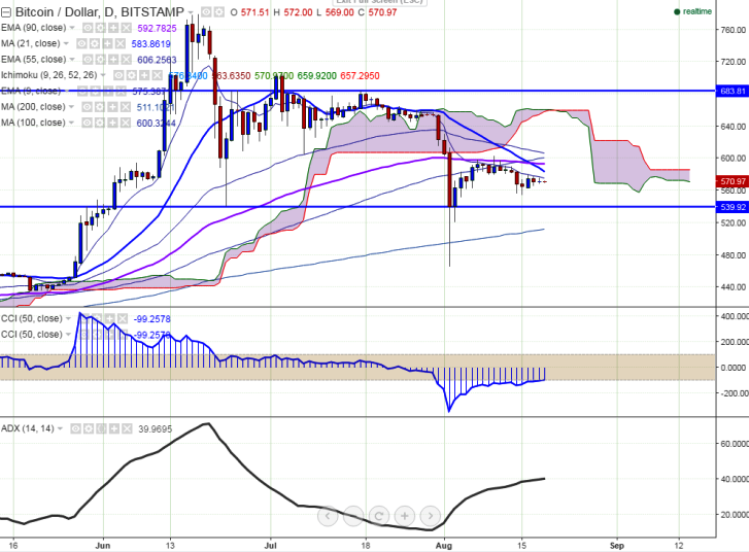
BTC/USD is trading in a narrow range between $579.80 and $566 for the past three trading session.It is currently trading at $570.97 (Bitstamp).
Long-term trend: bullish
Ichimoku analysis (Daily chart):
Tenkan-Sen level: $578.95
Kijun-Sen level: $565.14
Trend reversal level - (90 EMA) - $593.27
"The pair is facing minor resistance at $576.49 (9-day EMA) and break above that level confirms minor bullishness”, FxWirePro said in a statement.
Major resistance is around $578 (9-day EMA) and any break above targets $603 (Aug 10th 2016 high)/$609 (55-day EMA)/$617 (61.8% retracement of $705 and $465).
Short-term support is likely to be found at $565 (daily Kijun-Sen) and further weakness will target $540 (38.2% retracement of $465 and $583) $510.10 (200-day MA).
Text-to-speech function is limited to 100 characters
Germany changed clocks Sunday, Oct. 25, ahead of the U.S. shift on Sunday, Nov. 1. Deribit’s monthly Bitcoin (BTC) options expire Friday at 4 a.m. ET (08:00 UTC), or 9 a.m. CET in Berlin.