


 FxWirePro: GBP/AUD gains some upside momentum but still bearish
  FxWirePro: USD/CAD runs out of steam but maintains bullish outlook
  NZDJPY Pullback: Sell Rallies Toward 93.30 as Yen Weakness Eases
  FxWirePro: GBP/NZD maintains bersish bias with focus on 2.2900 level
  JPY Action Bias: USDJPY Emerges as the Clear Bullish Pair to Watch Amid Mixed Crosses
  FxWirePro: EUR/NZD up trend gains momentum but hurdles ahead
  JPY Pairs Action Bias: EURJPY Leads as Bullish Standout Amid Mixed Momentum
  FxWirePro: USD/ZAR retreats but trend is still bullish
  FxWirePro- Woodies pivot (Major)
  FxWirePro: AUD/USD falls after softer-than-expected Australian Q2 CPI
  FxWirePro: GBP/USD edges higher as traders await BoE guidance and UK fiscal clarity
  FxWirePro: USD/JPY eases ahead of Fed decision , Intervention risks linger
  FxWirePro- Major Pair levels and bias summary
  Major Pairs Action Bias: USDCAD and USDCHF Stand Out as Extremely Bullish While GBPUSD and NZDUSD Turn Extremely Bearish
  FxWirePro: NZD/USD neutral in the near-term, scope for downward resumption
  EUR/USD Bounces from Monthly Low, But Bearish Pressure Remains


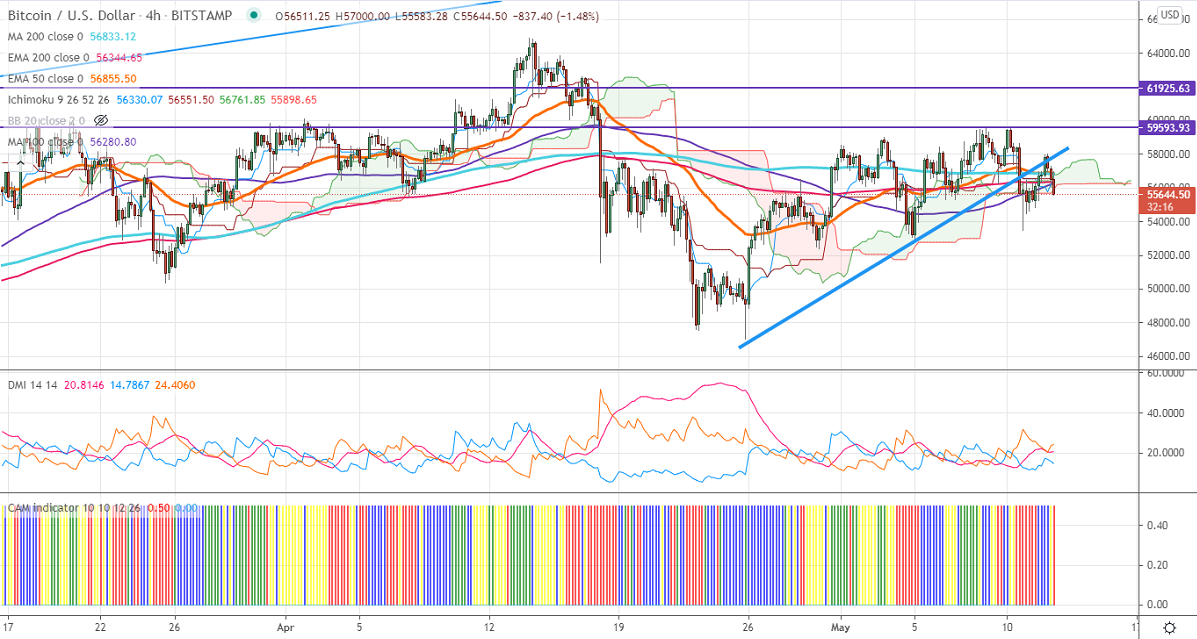
Ichimoku analysis (4-hour chart)
Tenken-Sen- $56260
Kijun-Sen- $56551
BTCUSD is consolidating in a narrow range between $59650 and 52950 for the past two weeks. The pair downside is capped by 100-day EMA and significant weakness only below that level. The break of wedge pattern confirms minor bearishness a dip till $53000. The intraday bullishness can happen only if it breaks $60000. It hits an intraday low of $55618 and is currently trading around $55807.
The near-term resistance is around $60000. Any indicative break above targets $61700/$65000. Major trend continuation above $65000.
The pair's minor support is around $55180 (61.8% fib). A break below will drag the pair down to$54500/ $52916 (100- day MA)/$47000. Any close below $47000 will drag the pair down to $43000. Significant bearishness only if it breaks $43000.
Indicator (4-Hour chart)
CAM indicator – Bearish
Directional movement index – Bearish
It is good to sell on rallies around $57000 with SL around $60000 for TP of $47000.


