FxWirePro: Buy AUD/JPY binary calls for speculating; put spreads for hedging
On intraday charts, hammer pattern candlestick formed at 91.47 levels on declines. A hammer appears on a downtrend at or near the bottom which suggests that the market is hammering out a base.Slow stochastic suggest over…
On intraday charts, hammer pattern candlestick formed at 91.47 levels on declines. A hammer appears on a downtrend at or near the bottom which suggests that the market is hammering out a base.
Slow stochastic suggest oversold pressure as %D line crossover formed below 20 level. (%D line at 9.2076 & %K line at 8.6436).
As the pair is trading near lower Bollinger band at 91.3413 levels and prices are considered to be oversold if they touch the lower band, Rising prices are confirmed with the substantial volumes but not on falling side.
So please be advised that on speculation basis for an intraday trading perspective we recommend buying binary call options for targets at 91.55 and even at 91.60 levels.
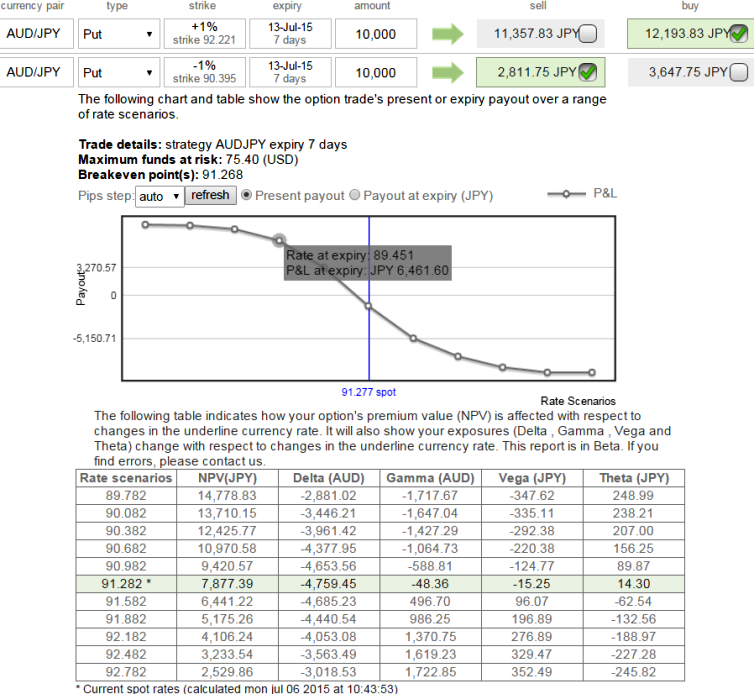
On hedging grounds, we are advocating bear put spreads to arrest downside risks as the major trend seems to be downtrend.
On weekly chart oscillators suggest downward convergence with the falling prices. RSI (14) converges price slumps at 48.4391. While stochastic shows %D line crossover but not significant though yet above 20 levels.
With a view being bearish bias we recommend buying 7D (1%) In-The-Money 0.74 delta put option while sell 7D (-1%) Out-Of-The-Money put options for a net debit (something like USD 9391.83 as shown in the diagram).
Australia's September 2026 labour report shocked to the negative: unemployment climbed to 4.7% from 4.6% and employment dropped by 39,300 against expectations for a 20,000 increase. Part-time work dropped by 73,700, whic…
UNCX Network, a cryptocurrency token vesting platform formerly known as UniCrypt, suffered a security exploit on Wednesday that drained approximately $86,000 from its shared Ethereum token pool. Blockchain security firm …
Solana is preparing to introduce its highly anticipated Alpenglow consensus upgrade on October 21, 2026, marking one of the blockchain's biggest technological changes since its launch in 2020. The upgrade aims to signifi…