


 FxWirePro: EUR/ AUD dips below 1.6300 level, focus on near term support
  FxWirePro- Woodies pivot (Major)
  FxWirePro:USD/JPY hovers near 40-year peak,intervention fears linger
  FxWirePro: GBP/USD stays below 1.3400 level following cooler inflation report
  FxWirePro: AUD/USD bulls struggles as upside momentum fades
  GBPJPY Weakens on Soft UK CPI: Sell Below 217.80 Targeting 216.40
  FxWirePro- Major Crypto levels and bias summary
  FxWirePro: USD/ZAR slips as rand gains on U.S.-Iran developments
  FxWirePro: GBP/AUD downtrend loses steam but outlook still bearish
  FxWirePro: GBP/AUD dips amid heightened Geopolitical concerns
  ETHUSD Breaks Above $1900 as Bulls Eye $2300 and Beyond
  Major Pair Action Bias: USDCHF Turns Bullish as EURUSD Stays Bearish – Key Pairs to Watch
  Major Crypto Action Bias: ETHUSD Turns Bullish – Only Bullish Pair to Watch
  FxWirePro- Major Pair levels and bias summary
  NZDJPY Pulls Back on Kiwi Weakness: Buy Dips at 94.40 Targeting 97


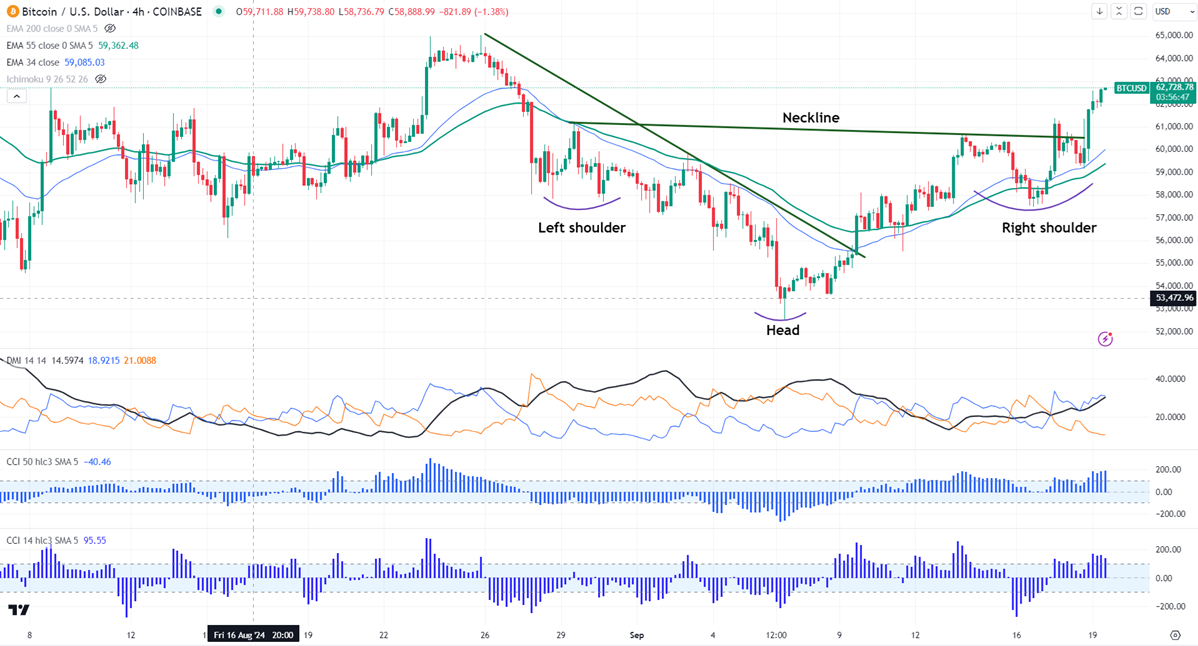
Chart pattern- Inverted Head and Shoulder
Potential reversal zone- $52530.
BTCUSD broke the neckline and held above that level after the Fed rate cut. It hit a high of $62736 at the time of writing and is currently trading at around $62699.
US Fed cut rates by 50 bpbs yesterday to 4.75% -5% compared to a market estimate of 25 bpbs. The central bank mentioned that Job gains have slowed and inflation is moving towards fed target of 2% but remains slightly elevated.
BTCETF saw inflows of $250 million on Monday led by iShares Bitcoin drew $15.8 million.
US markets -
NASDAQ (No correlation with BTC) - Bullish (neutral for BTC). The NASDAQ trades higher after the 50 bpbs rate cut. Any close above 20000 will take the index to 20500.
Technicals-
BTCUSD trades above the short-term moving average 34- EMA and below 55 EMA and the long-term moving average (200 EMA) in the 4-hour chart.
Minor support- $57000. Any break below will take it to the next level at $55000/$52500/$50000/$46000.
Bull case-
Primary supply zone -$63000. Any break above confirms a intraday bullishness. A jump to $65000/$67000/$70000 is possible.
Secondary barrier- $70000. A close above that barrier targets $750000/$80000.
Indicator (8-hour chart)
CCI (14)- Bullish
CCI (50)- Bullish
Average directional movement Index - Bullish
It is good to buy on dips around $61500 with SL around $58500 for TP of $70000.


