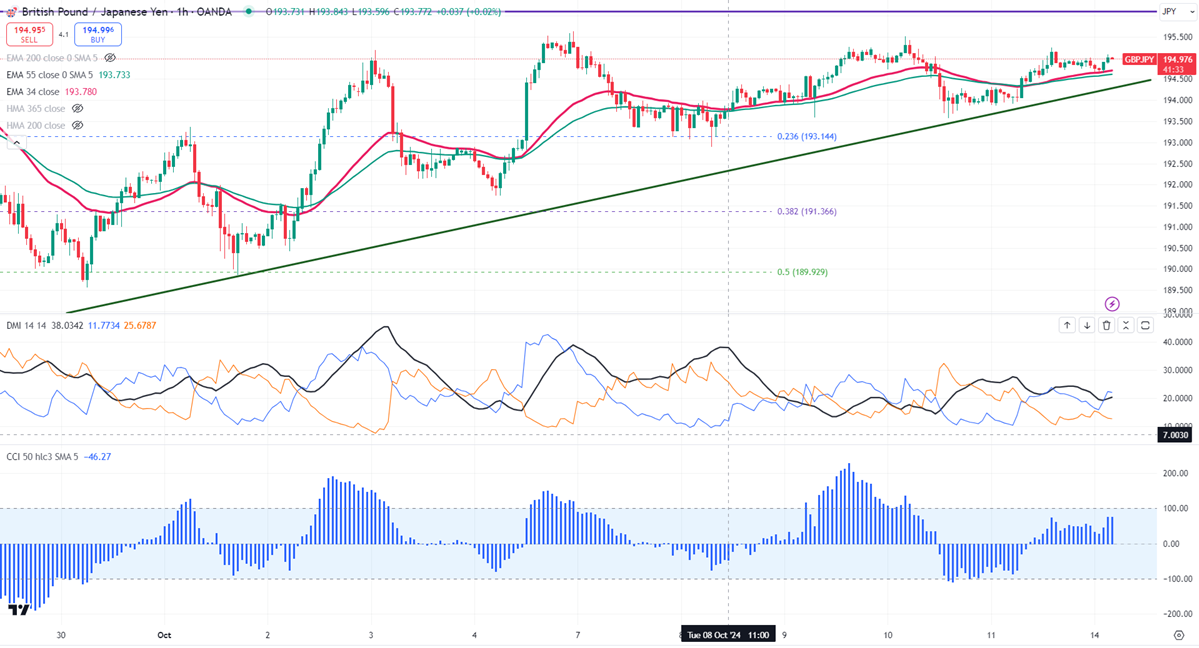
GBPJPY consolidated in a narrow range between 192.88 and 195.62 in the past week. It hit a high of 195.08 at the time of writing and is currently trading around 195. Overall trend remains bullish as long as support 193.50 holds.
The recent price action shows that GBP/JPY has remained in a range below 195.95, with an intraday bias remaining neutral for the day.
Technicals-
The pair is trading above short-term 34, above 55 EMA (193.72 and 194.49), and long-term 365 Hull MA (194.51) in the one-hour chart.
The near-term resistance is around 195.65, breaching above the target of 195.95. A break above 195.95 would indicate a resumption of the upward movement from the low of 180.00. A jump to 197.37 (161.8% fib)/198/200 is possible. The immediate support is at 194.50, any violation below will drag the pair to 193.80/193.50/192.88/192.50.
Indicator (1-hour chart)
CCI (50)- Bullish
ADX- Bullish All indicators confirm a bullish trend.
It is good to buy on dips around 194.50 with SL around 193.50 for a TP of 197.37.


