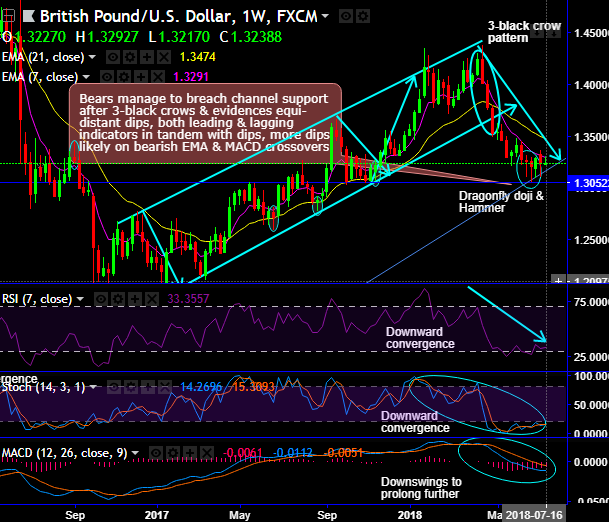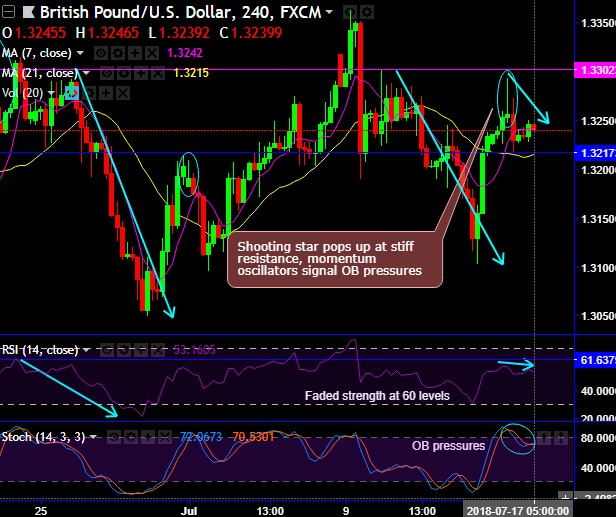
Chart and candlestick patterns occurred: shooting star has occurred at 1.3256 levels where stiff resistance is observed at 1.3302 levels (refer 4H chart), one can observe the bearish sentiments on failure swings at that juncture in the recent past as well. On the contrary, dragonfly doji and hammer pattern candles have occurred at 1.3258 and 1.3203 levels that are holding strong supports at 1.3052 levels (refer weekly plotting).
While 3-black crows pattern during the consolidation phase has occurred at 1.3525 levels which are bearish in nature, the intermediate trend so far was spiking through rising channel (weekly chart), but for now, bears have managed to breach below this channel support and evidences equi-distant dips. In addition, ever since the occurrence of 3-black crow pattern candles, considerable slumps below EMAs are observed on this timeframe.
Consequently, the price slides below DMAs, EMAs and MACD with bearish crossovers ever since the occurrences of the above traced-out bearish patterns, let’s not forget we cannot afford to isolate this signal, both leading and lagging indicators in tandem with price dips.
Both momentum oscillators (RSI & stochastic curves) have shown constant downward convergence on both timeframes that indicate the strength and the momentum in the bearish trend. MACD and EMAs show bearish crossovers that indicate bearish swings to prolong further.
Trade tips:
On daily trading grounds, at spot reference: 1.3254 levels, we advocate buying tunnel option spreads using 1.3272 as upper strikes and 1.3235 as lower strikes. Tunnel spreads are the binary version of the debit put spreads, the strategy is likely to fetch positive yields as long as the underlying price keeps dipping but remains well above lower strikes on the expiration.
Alternatively, one can stay shorts in futures contracts of mid-month tenors with a view to arresting potential downside risks ahead of BoE governor Carney’s speech. Writers in a futures contract are expected to maintain margins in order to open and maintain a short futures position.
Currency Strength Index: FxWirePro's hourly GBP spot index is flashing -35 (which is bearish), while hourly USD spot index was at -18 (mildly bearish) while articulating (at 06:25 GMT). For more details on the index, please refer below weblink: