Gold -
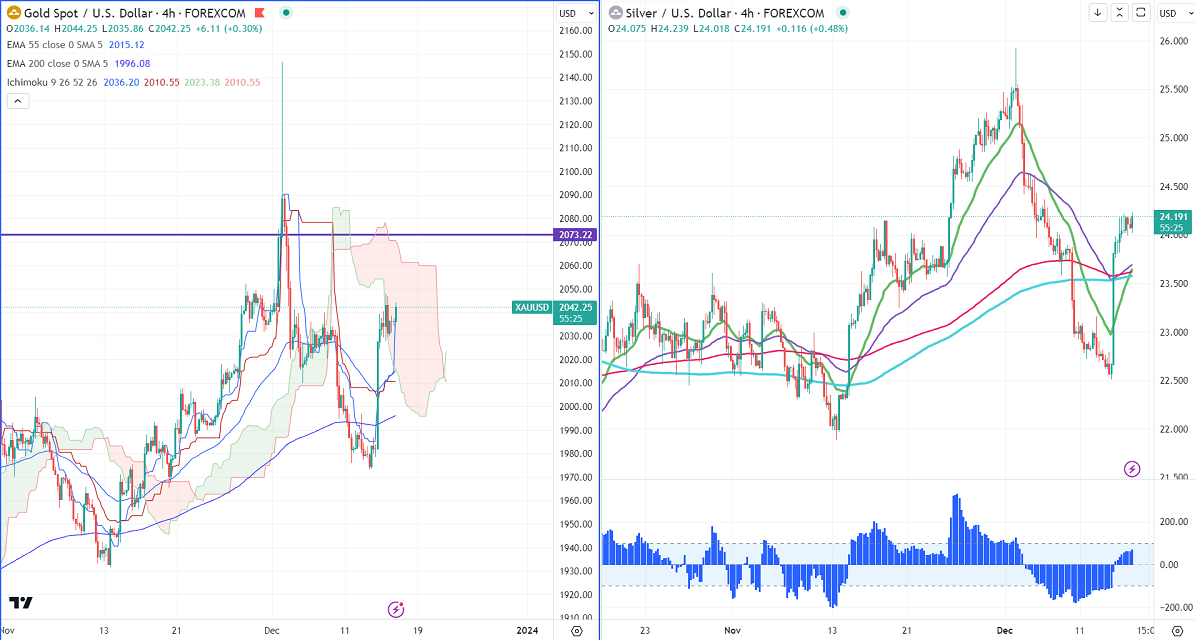
Ichimoku Analysis (4 hour chart)
Tenken-Sen- $2015
Kijun-Sen- $2010.55
Gold is consolidating in a narrow range after the massive jump on Wednesday. It hit a high of $2047.95 and is currently trading at around $2038.56.
It rose by 0.30% in Nov compared to a forecast of -0.10%. Core retail sales excluding autos jumped 0.20% vs. an Estimate of 0.10%. The number of people who have filed for unemployment benefits dropped by 19000 last week to 202000, compared to a forecast of 219K. Major economic data for the day
Economic Data for the day -
Dec 15th, 2023, US Empire State Manufacturing Index (1:30 pm GMT)
US Flash Manufacturing PMI (2:45 pm GMT)
US dollar index- Bearish. Minor support around 102.40/101. The near-term resistance is 103.25/104.
According to the CME Fed watch tool, the probability of a no-rate hike declined to 85.50% from 89.90% a day ago.
Factors to watch for gold price action-
Global stock market- Bullish (negative for gold)
US dollar index - Bearish (positive for gold)
US10-year bond yield- Bearish (Positive for gold)
Technical:
The near–term support is around $2020, a break below targets of $2000/$1970. The yellow metal faces minor resistance around $2050 and a breach above will take it to the next level of $2070/$2100.
It is good to buy on dips around $2000 with SL around $1986 for TP of $2150.
Silver-
Silver struggling to break significant resistance around $24.20 (50% fib retracement). Any breach above $24.20, a jump to $25/$26. Minor support is $23.60/$23.
Crude oil-
WTI crude holds above $70 as demand improves. According to the International Energy Agency (IEA), world oil consumption will rise by 1.1 million barrels per day.
Major resistance- $75/80. Significant support- $66.50/$63.