
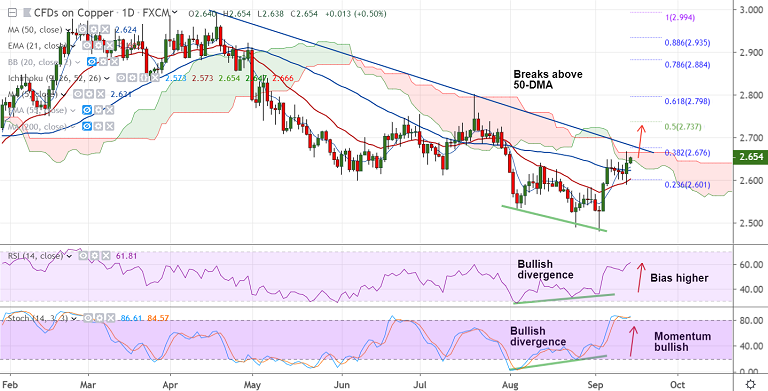
COPPER chart - Trading View
Support levels - 2.631 (5-DMA), 2.602 (21-EMA)
Resistance levels - 2.668 (21W EMA), 2.676 (38.2% Fib and trendline)
Copper prices have been edging higher from over 2-year lows of 2.480 hit on Sept 3rd trade.
Major trend is bearish, but signs of recovery seen. Price has bounced off lower Bollinger band on the weekly charts.
After extending consolidation for a few sessions around 50-DMA resistance, the pair has resumed upside.
Copper was trading 0.48% higher on the day at 2.653 at 03:00 GMT, bias bullish.
Stochs and RSI are sharply higher and a bullish divergence on the daily charts supports gains.
Price action currently finds stiff resistance in the 2.668 - 2.676 zone. Break out will see upside continuation.
Next bull target lies at 200-DMA at 2.738 ahead of 61.8% Fib retracement at 2.798.
For details on FxWirePro's Currency Strength Index, visit http://www.fxwirepro.com/currencyindex.


