


 FxWirePro: USD/JPY gains above 160 level ahead of BOJ policy meeting
  FxWirePro- Woodies pivot (Major)
  GBPJPY Coil Tightens: Is a Bullish Break Above 215.60 Imminent?
  Ethereum Cracks Under $1,700: Sell the Rally Near $1,750 as Bears Eye $1,380–$1,200
  Sell the Bounce: NZDJPY Bearish Bias Persists Below 94.20, Eyes 90.50
  FxWirePro: USD/ CNY falls towards 6.750, bears keep the advantage
  FxWirePro: NZD/USD jumps after US and Iran agree preliminary deal
  FxWirePro: USD/CAD steadies around 1.3990 ,retains bid one
  FxWirePro: AUD/USD climbs as US-Iran peace deal sparks risk rally
  FxWirePro: GBP/AUD runs out of steam but maintains bullish outlook
  FxWirePro: GBP/AUD eases on Geopolitical whipsaw
  FxWirePro- Woodies pivot (Major)
  FxWirePro: EUR/ NZD uptrend loses steam, remains on bullish path
  FxWirePro: GBP/USD range-bound as Iran uncertainty keeps traders cautious
  Relief Rally Extends to 112.75, but AUDJPY EMA Structure Favors Selling


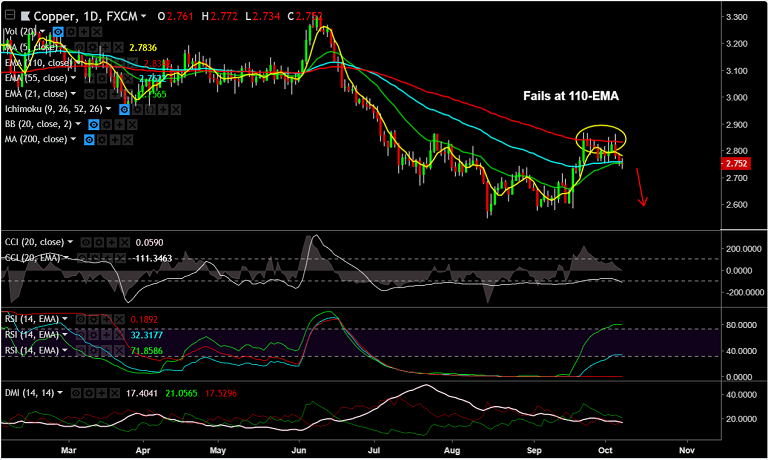
COPPER chart on Trading View used for analysis
- Copper is extending weakness after failure to break above 110-EMA.
- Technical indicators on daily charts have turned bearish with 5-DMA now sloping downward.
- Stochs and RSI on the daily charts are also biased lower and MACD is on verge of bearish crossover on signal line.
- Price has slipped below major EMAs and we see scope for dip till 2.60 (nearly converged 200W SMA and trendline).
- The pair has seen multiple rejections at 20W SMA and we see bullish resumption only on breakout above.
Support levels - 2.707 (Sept 20 low), 2.606 (200W SMA)
Resistance levels - 2.783 (5-DMA), 2.827 (20W SMA)
FxWirePro Currency Strength Index: FxWirePro's Hourly USD Spot Index was at 71.9337 (Neutral) at 1330 GMT.
For more details on FxWirePro's Currency Strength Index, visit http://www.fxwirepro.com/currencyindex.


