


 FxWirePro- Major Pair levels and bias summary
  JPY Action Bias: EURJPY and CADJPY Emerge as Extremely Bullish Pairs to Watch
  U.S. Treasury Yields Expected to Decline Amid Cooling Economic Pressures
  Moldova Criticizes Russia Amid Transdniestria Energy Crisis
  FxWirePro: AUD/USD gains some ground but outlook is bearish
  European Stocks Rally on Chinese Growth and Mining Merger Speculation
  Gold Prices Fall Amid Rate Jitters; Copper Steady as China Stimulus Eyed
  FxWirePro- Woodies pivot (Major)
  Major FX Action Bias & US Market Sentiment: NZD/USD (Extremely Bullish) & AUD/USD (Bullish) Watchlist
  FxWirePro: AUD/USD dips below lower range, bearish bias increases
  U.S. Banks Report Strong Q4 Profits Amid Investment Banking Surge
  Goldman Predicts 50% Odds of 10% U.S. Tariff on Copper by Q1 Close
  S&P 500 Relies on Tech for Growth in Q4 2024, Says Barclays
  Major European Indices Score Extremely Bullish: DAX Eyes 26000, CAC Targets 8600, FTSE100 at 11000 – Key Levels to Watch
  FxWirePro: USD/CAD slips after Fed holds rates steady
  Gold Prices Slide as Rate Cut Prospects Diminish; Copper Gains on China Stimulus Hopes
  AUD/JPY Slips Below 112 as BOJ Intervention Sparks Bearish Momentum: Sell the Rallies


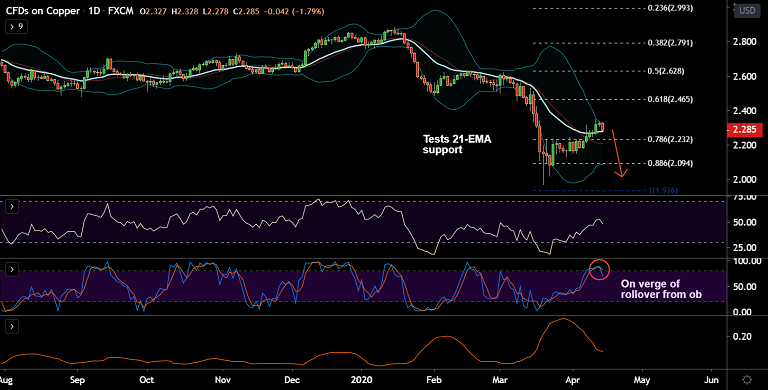
Copper chart - Trading View
Copper extends retreat from 4-week highs at 2.350, bias is turning slightly bearish.
The pair was trading 1.68% lower on the day at 2.288 at around 09:15 GMT after closing 0.32% higher in the previous session.
Technical indicators are turning bearish. Stochs are on verge of rollover from overbought levels.
Price action has slipped below 5-DMA and is testing 21-EMA support at 2.279. Decisive break below will see more weakness.
Major trend in the pair is bearish as evidenced by GMMA indicator. Minor trend is turning bearish.
Break below 21-EMA eyes 88.6% Fib at 2.094. Failure to break below 21-EMA negates bearish bias.
Support levels - 2.257 (200H MA), 2.094 (88.6% Fib)
Resistance levels - 2.331 (Upper BB), 2.400 (55-EMA)


