The WTI crude oil price rallies have extended their recent recovery upto the current $72.02 levels, with WTI particularly supported by hurricane risks.
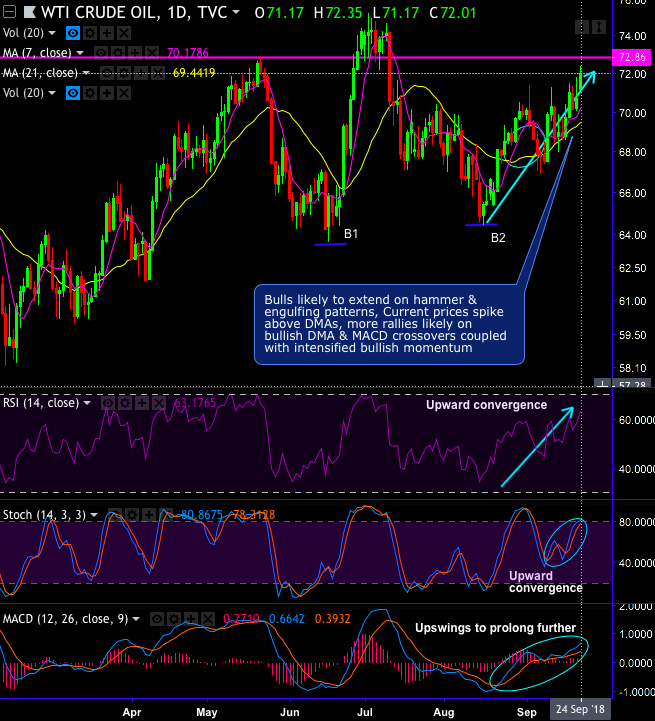
Technically,WTI crudeon daily plotting forms double bottom pattern which is bullish in nature formed with bottom 1 at $63.62 and bottom 2 at $64.45 levels. Stiff resistance is observed at $72.86 levels.
For now, the bulls most likely to drag this bullish pattern, the current prices spike above DMAs, more rallies likely on bullish DMA and MACD crossovers coupled with intensified bullish momentum.
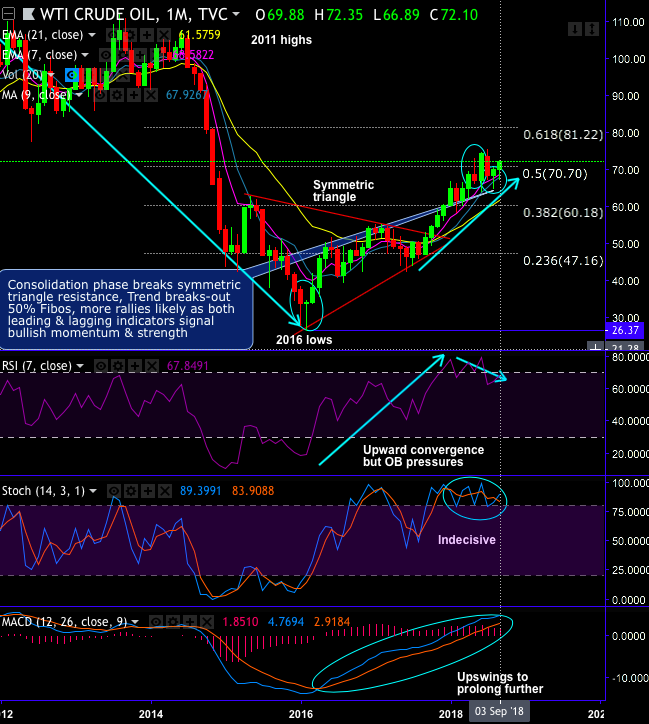
While the consolidation phase breaks-out symmetric triangle resistance (refer monthly chart), as a result, the uptrend retraces more than 50% Fibonacci levels of the lows of February 2016 (i.e. $26.08) and the highs of May’2011 (i.e. $114.79 levels). That’s where, the trend seemed slightly edgy with occurrences of shooting star and hanging man formations, but bulls bounce back well beyond EMAs and 50% Fibonacci levels.
Momentum and trend study: The prevailing uptrend to sustain upon bullish DMA and MACD crossovers that is coupled with intensified bullish momentum as both leading oscillators (RSI & stochastic curves) show upwards convergence to the price rallies on daily terms, where these momentum oscillators indicate overbought pressures at this juncture.
While energy prices sneaked past ($80 in case of brent and $72 in case of WTI) a barrel on today as mining nations like Russia and Saudi Arabia decided against mounting global production at a meeting in Algiers.
Over the last weekend, Saudi Arabia, one of the 14-member Organization of the Petroleum Exporting nations, and Russia, which is the charioteer for the 11 other associated oil producers, have reinforced that they intend to adhere to production quotas to which they agreed in late 2016.
Nevertheless, confining to these thresholds would imply that an extra 500,000 barrels a day would inflow into global energy markets to counterweigh the projected deteriorations once the lingering Venezuela’s economic crisis continues and as the Iran sanctions to reflect. While effects of dollar’s robustness on the oil price eases their pain of struggling OPEC producers, like Algeria, Nigeria and Venezuela.
Overall, on trading grounds, it is good to buy at current levels for further upside traction upto $72.86 levels for the strict stop loss of $71.35 levels.
While on hedging grounds, we advocate initiating longs in WTI CME futures contracts with a view to arresting further upside risks.
Currency Strength Index: FxWirePro's hourly USD spot index is inching towards 41 levels (which is mildly bullish), while articulating (at 13:25 GMT). For more details on the index, please refer below weblink: