


 Economic pessimism has set in – but there are reasons for Australians to be hopeful
  Michael Burry Shorts Tesla at $416 as AI and Semiconductor Bearish Bets Expand
  Open-Source AI Models Gain Ground as Enterprises Seek Lower-Cost Alternatives, Citi Says
  Morgan Stanley Sees Chinese Auto Market Recovery Gaining Momentum in Late Summer
  A Korean Family Spent 34 Years Hoarding Chinese Tea. Now They're Putting It on the Blockchain.
  Part II — The listing: NFTs as bottle-stamps, and a vault the family is in no rush to sell
  Morgan Stanley Names BAE Systems Top European Defence Stock Despite Lower Price Target
  Europe Heatwave Creates Growth Opportunity for Carrier, Trane, and Johnson Controls, Citi Says
  Gold Surges Above Key EMAs, Bulls Eye Resistance Amidst Bullish Momentum


The global crude oil prices are lingering to be drawn between the varying influences of reports of tumbling OPEC production and mounting US crude inventories. The US crude inventories reached a new record high last week, based on the data that stretches back to 1981. The US stock build directs an instructive indication to the market at a time when stocks should be starting to decline, rather than build.
US production is responding positively to higher prices and, as discussed last week, we and the market may not have fully accounted for the rate at which US shale producers have increased supply in recent months. Faster than expected builds in US crude stocks may reflect a structural under-reporting of US shale oil production.
The EIA (U.S. Energy Information Administration) is scheduled to release its official crude inventory reports at 16:00GMT, Thursday.
Yesterday, the American Petroleum Institute said that U.S. oil inventories unexpectedly dropped by 884,000 barrels in the week ended February 17, breaking a trend of six-straight builds.
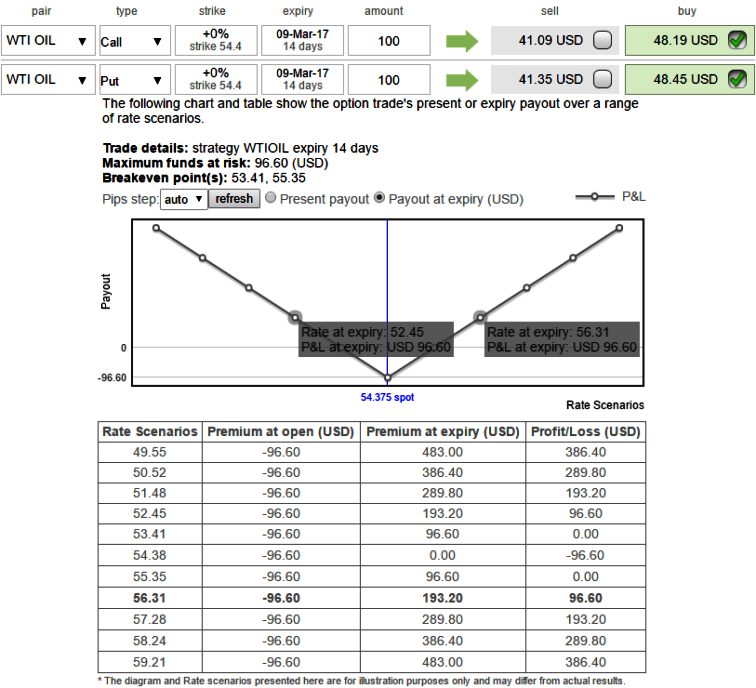
The Strategy:
Ahead of today’s EIA’s inventory check, as shown in the diagram, we advocate buying 2w ATM +0.51 delta call and ATM -0.49 delta put of the same expiry at net debit.
Stay long in the Mar’09 2017 WTI $54.50/bbl straddle, as the energy markets are still tightly bound in the narrow price range that has held them from last two and a half months approximately.
The strategy derives unlimited returns with limited risk to the extent of initial premium paid that are used when the hedger ponders that the underlying commodity would experience significant volatility in the near term.
Rationale: The conflicting pull of rising US crude stocks and falling OPEC production will likely spur prices to breakout of this range, so we retain the long the April WTI $55/bbl straddle.
Capitalizing on above stated fundamental news which is significant that could cause high yielding volatilities, so, we suggest trading the expectancy of increased volatility without taking a view on direction. A strategy commonly used over major economic announcements and events.
Risk/return profile: The profit increases as the underlying market rises or falls. The maximum loss is the premium paid for the options. The loss is less between strike price A and break-even points.
Effect of Volatility: The value of both options will increase as volatility increases (good) and will decrease as volatility falls (bad).
Effect of Time decay: The value of both options decay each day that passes (bad).
Alternatively, the directional investors not given to active delta-hedging can consider buying calendar spreads of call instead of straddles.


