


 FxWirePro- Major Crypto levels and bias summary
  NZDJPY Bullish Dip-Buy Setup: 93.60 Support Unlocks Path to 97
  NZDJPY Action Bias: Bullish Dip-Buying Opportunity on Broad Yen Weakness
  AUDJPY Action Bias: Bullish Dip-Buy Setup Despite Flat Neutral Bias
  FxWirePro: GBP/NZD downside pressure builds, key support levels in focus
  FxWirePro :USD/JPY eases slightly, remains on bullish path
  FxWirePro- Woodies pivot (Major)
  FxWirePro- Woodies pivot (Major)
  JPY Action Bias: USDJPY, EURJPY, and CADJPY Emerge as Top Extremely Bullish Picks
  FxWirePro: USD/CNY dips as yuan firms on improving risk appetite
  FxWirePro- Major Crypto levels and bias summary
  FxWirePro: NZD/USD gains as U.S.-Iran peace hopes boost risk sentiment
  FxWirePro- Major Pair levels and bias summary
  GBPJPY Slips After Sterling Weakness, Bears Eye 216
  FxWirePro: GBP/AUD under pressure as pound continues to weaken
  FxWirePro: EUR/NZD downside pressure builds, key support level in focus


Short term trend – Bullish
Intraday trend –Bearish
Chart pattern- bearish divergence
Ichimoku Analysis (4-Hour chart)
Tenken-Sen- 98.60
Kijun-Sen- 98.07
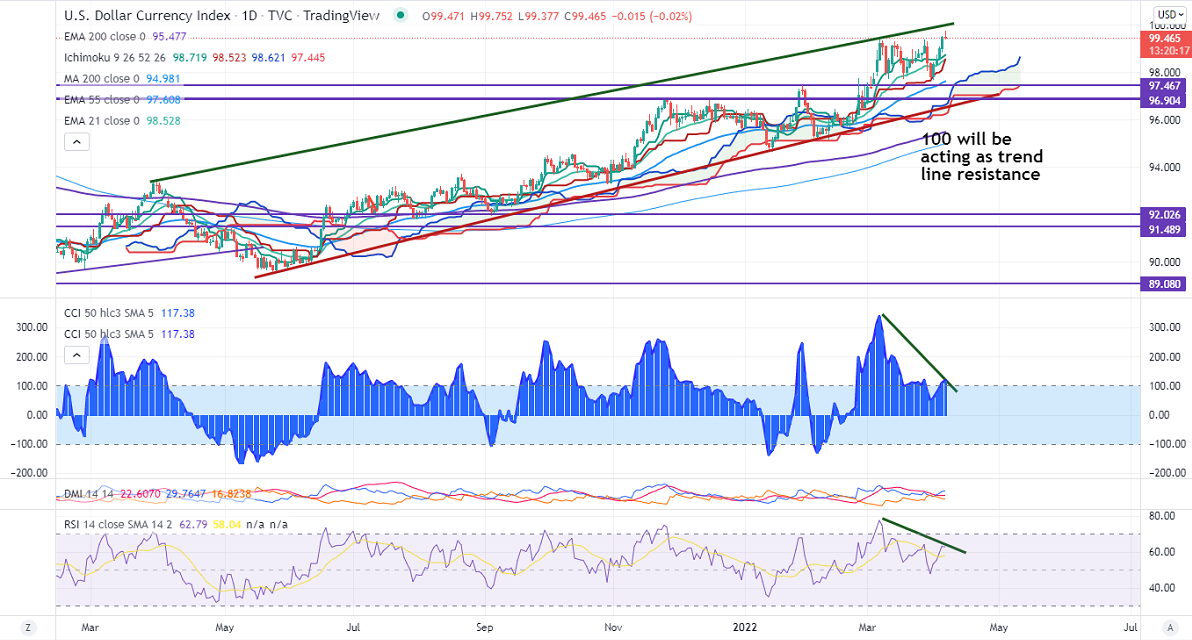
The US Dollar index performed well this month and surged nearly 200 pips from a low of 97.68. The index halted its bullish trend and showed a minor profit booking. Markets eagerly await US Fed meeting minutes for further direction. The US 10-year yield hits a fresh year high in hopes of an aggressive rate hike by Fed. It hits an intraday low of 99.37 and is currently trading around 99.41.
The near-term resistance is around 100 any convincing break above confirms further bullishness. A jump to 102/103 is possible. Short-term bullish continuation only if it breaks 103.
On the lower side, immediate support stands at 99.25, any indicative break below will take the index to 98.67/98.
Indicator (Daily chart)
CCI (50)- Bullish
Directional movement index –Bullish
It is good to sell on rallies around 99.50-52 with SL around 100 for a TP of 98.


