As per our previous post on technical analysis of EURJPY, the pair has shown considerable price rallies upon below mentioned price behavioral patterns.
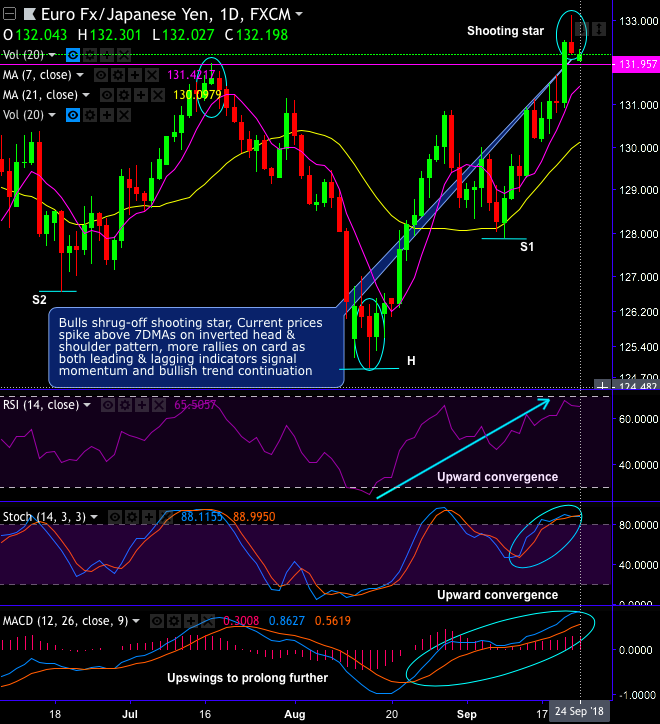
Technical chart and candlestick patterns formed – Gravestone doji and shooting star patterns have occurred at 131.052 and 132.234 levels respectively which are bearish in nature (refer daily chart).
On the contrary, the stern resembling bullish engulfing patterns with big real body have occurred at 130.855 and 132.478 levels that helps in completing inverted head and shoulder chart pattern which is bullish in nature. The pair forms inverted head and shoulder pattern with head at 124.903, shoulder 1 at 127.868 and shoulder 2 at 126.643 levels.
Consequently, you can make out sharp current rallies that spike above 7DMAs on this bullish pattern, for now, more rallies on card as both leading and lagging indicators signal intensified momentum and bullish trend continuation.
To substantiate this bullish stance, today, bulls have continued their business despite last weekend’s formation of shooting star at 132.234 levels.
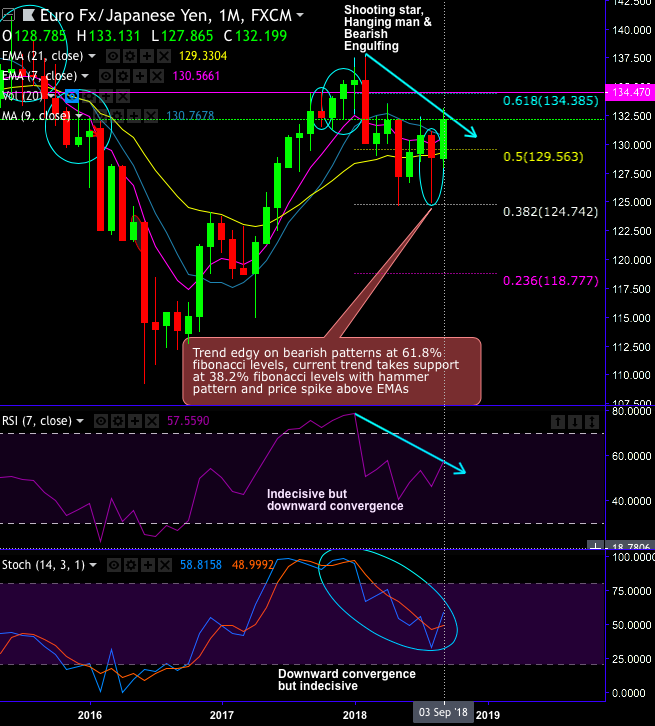
While on intermediate trend, consecutively shooting star, hanging man and spinning top patterns pop up at around 61.8% Fibonacci levels from the lows of June 2016. On the contrary, hammer patterns have occurred at 128.830 levels sensing support at 124.742 (i.e. 38.2% Fibonacci levels) to counter the bearish sentiments (refer monthly chart). Bulls, on this timeframe, resume after retracing 38.2% Fibonacci levels.
While both leading and lagging indicators signal strength and momentum in momentary upswings and weakness remains intact on the monthly terms.
Trade tips: On trading perspective, at spot reference: 132.208 levels, it is advisable to buy one touch call option, use strikes at 132.478 levels, the strategy is likely to fetch leveraged yields as long as the underlying spot FX keeps spiking further until expiration.
Alternatively, ahead of ECB’s Draghi’s speech today, we advocate shorts in futures contracts of mid-month tenors with a view to arresting potential dips.
Currency Strength Index: FxWirePro's hourly EUR spot index is flashing at 77 levels (which is bullish), while hourly JPY spot index was at -35 (mildly bearish) while articulating at 05:25 GMT. For more details on the index, please refer below weblink:
http://www.fxwirepro.com/currencyindex
The above indices are also conducive for our above trading strategy.