


 USD/CHF Retreats to Key Trend-Line Wall; Buy-Above-0.8000 Strategy Targets Sharp Rally to 0.8150
  FxWirePro: GBP/USD hovers near three week low, bearish outlook remains
  FxWirePro: NZD/USD gains slightly but bearish outlook remains
  FxWirePro- Woodies pivot (Major)
  FxWirePro- Major Pair levels and bias summary
  AUD/JPY Dead-Cat Bounce Halted by EMA Wall; Sell-on-Rise Eyes 110.50 Target
  FxWirePro: GBP/NZD edges lower but bias is bullish
  FxWirePro:GBP/USD recovers some ground but bears are not done yet
  FxWirePro: EUR/ NZD bulls gain momentum,eyes level 2.0000
  FxWirePro- Major European Indices
  FxWirePro- Woodies pivot (Major)
  FxWirePro- Major Crypto levels and bias summary
  FxWirePro USD/JPY consolidates above 160.00 level despite fresh currency intervention threats
  FxWirePro: EUR/ NZD consolidating around 1.9855, room for further gains
  FxWirePro: GBP/AUD eases slightly but trend is still bullish
  NZD/JPY Bear Trap: Triple EMA Ceiling Blocks Relief Rally, Sellers Eye 90.50
  FxWirePro- Major Crypto levels and bias summary


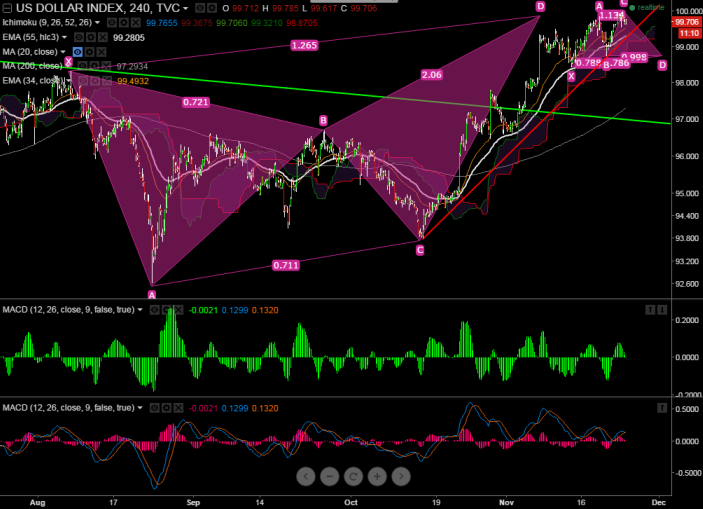
Long term harmonic Pattern: Bearish Butterfly Pattern
- Short term Harmonic Pattern- Bullish Cypher pattern
- Long term Potential Reversal Zone -101.52 (161.8% retracement of 98.33 and 93.16)
- Short term Potential Reversal Zone - 100.55 (161.8% retracement of 99.85 and 98.73)
- DXY has made a high of 100 and slightly retreated from that level. Short term trend is bearish as long as resistance 100.60 holds.
- Any break above 100.60 will take the pair to new level 101.55.
- The Dollar index minor support is around 99.50 and break below targets 99.20/98.70/98.35/97.40
It is good to sell on rallies around 99.95-100 with SL around 101.50 for the TP of 98.70/97.40


