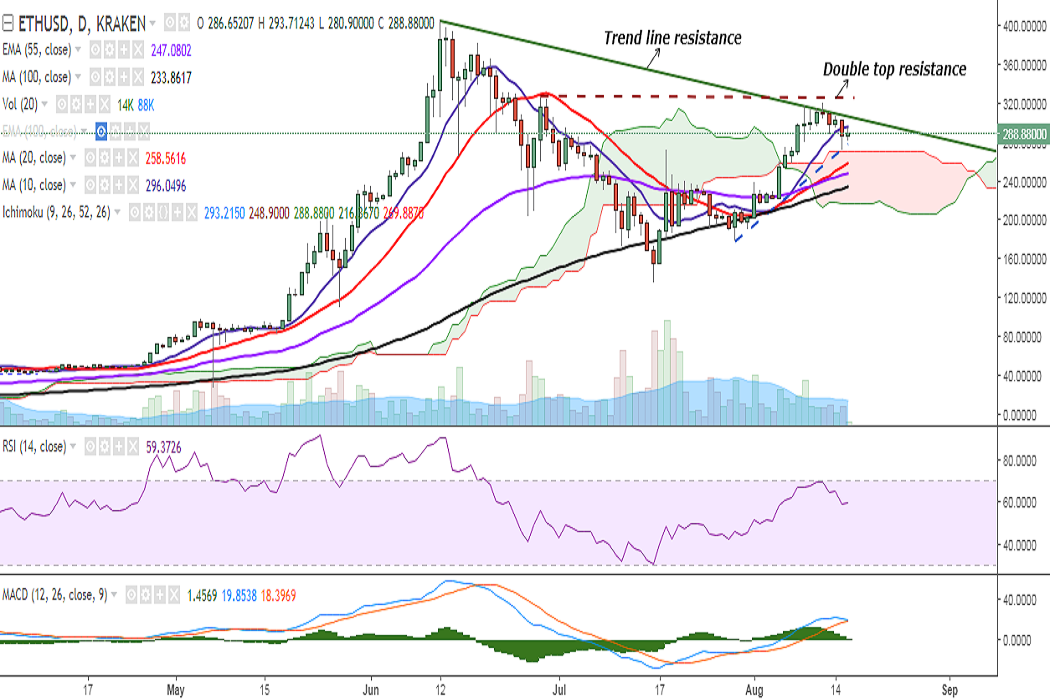
ETH/USD is trading in a narrow range on Wednesday after it fell to 271 levels on August 15. It is currently trading at 287 levels at the time of writing (Kraken).
Ichimoku analysis (Daily chart):
Tenkan-Sen: 293.21
Kijun-Sen: 248.90
On the upside, immediate resistance is seen at 295 (10-DMA) and a break above would target 306 (trend line joining 404.98 and 316.92)/325 (double top resistance). Further strength would see it testing 347 (78.6% retracement of 404.98 and 134.78). 381 (June 18 high)/404 (June12 high).
On the flip side, support is seen at 276 (trend line joining 177.80 and 271) and a break below would see it testing 258 (20-DMA)/241 (50-DMA). Further weakness would drag it to 233 (100-DMA)/ 193 (1w 20-SMA).
Momentum studies: On the daily chart, RSI is at 59, while MACD line is closing in on the signal line from above. Also, stochs have rolled over from the overbought zone. Bias appears weak on the hourly charts as well.
Recommendation: Wait for clear directional bias.
FxWirePro launches Absolute Return Managed Program. For more details, visit http://www.fxwirepro.com/invest