FxWirePro: ETH/USD recovers from the low of $10.09, good to sell on rallies
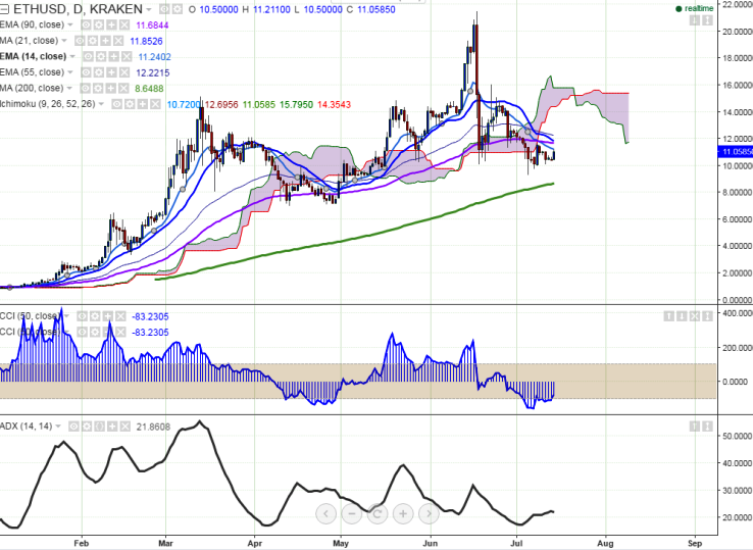
ETH/USD traded in the green on Thursday on the back of newly found momentum. It currently trades at 10.95 levels (Kraken) at press time. Long term trend: Bullish Short term: Bearish Ichimoku analysis (Daily chart): Tenka…
ETH/USD traded in the green on Thursday on the back of newly found momentum. It currently trades at 10.95 levels (Kraken) at press time.
Long term trend: Bullish
Short term: Bearish
Ichimoku analysis (Daily chart):
Tenkan-Sen $10.498
Kijun-Sen $12.69
Trend reversal - $11.72
“ETH/USD has broken minor resistance $11 and jumped till $11.21. In daily chart the pair is facing resistance around $11.69 (90 day EMA) and it should break above for further bullishness”, FxWirePro said in a statement.
Major resistance - $11.25 (14 day EMA) and any break above targets $11.72 (90 day EMA)/$11.97 (21 day MA). Major support - $10 and break below targets $9.30 (Jul 5 th 2016 low)/ $8.45 (127.2% retracement of $10.10 and $16.08).
Coinglass measured Ether options open interest at $5.81 billion, up 0.1% from the previous day, with calls representing most of both open interest and trading volume.