FxWirePro: ETH/USD trades slightly above 55 day EMA, targets $13.86
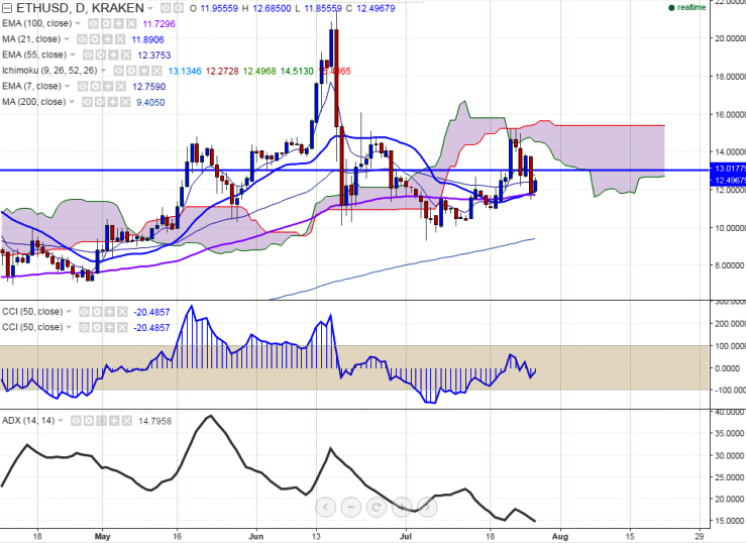
ETH/USD is seen trading above on Wednesday. The pair has slightly recovered after making a low of $11.50 levels (KRAKEN).It is currently trading around $12.40 at the time of writing. Ichimoku analysis of daily chart show…
ETH/USD is seen trading above on Wednesday. The pair has slightly recovered after making a low of $11.50 levels (KRAKEN).It is currently trading around $12.40 at the time of writing.
Ichimoku analysis of daily chart shows:
Tenkan-Sen $13.08
Kijun-Sen $12.27
Trend reversal - $11.71
Long-term and short-term trend remains to be bullish. In daily chart the pair is trading slightly well above 55 day EMA. So a slight jump till $13.08/$13.86 (61.8% retracement of $15.23 and $11.50).
Major resistance is seen at $13.08 (daily Tenken-Sen) and any break above targets $13.86 (61.8% retracement of $15.23 and $11.50)/$15. Major support can be noticed at $11.79 (21 day MA) and break below targets $11.50/$10.09 (Jul 11th low).
Potential short-liquidation exposure was reported above $85,000 in the week leading up to Oct. 15. A separate cluster near $75,000 has no stated position direction.
Issuance will stay level for about 12 months, then taper to zero over 24 months. Five community-nominated council candidates require confirmation by veHNT holders.