


 FxWirePro- Woodies pivot (Major)
  FxWirePro- Major Pair levels and bias summary
  Major European Indices Score Extremely Bullish: DAX Eyes 26000, CAC Targets 8600, FTSE100 at 11000 – Key Levels to Watch
  NZDJPY Bullish Rebound: Buy Dips as EMAs Align for 97 Target
  FxWirePro: USD/ZAR gains as stronger dollar outweighs upbeat South Africa's trade surplus
  FxWirePro: EUR/ AUD dips below 1.6400 level, focus on near term support
  FxWirePro: GBP/USD rises as soft US data pressures dollar
  FxWirePro: GBP/AUD bears maintain upper hand
  FxWirePro: USD/CAD retreats after Canada posts stronger-than-expected GDP growth
  NZDJPY Retreats on Yen Strength – Bearish Setup Targets 90 After Hitting 92.75 Low
  AUDJPY Volatile After Massive Sell-Off: Sell Rallies at 113, Targeting 110 as Bearish Momentum Surges
  FxWirePro: AUD/USD gains some ground but outlook is bearish
  FxWirePro- Major Crypto levels and bias summary
  AUD/JPY Slips Below 112 as BOJ Intervention Sparks Bearish Momentum: Sell the Rallies
  FxWirePro: GBP/AUD drifts lower after BOE rate decision
  FxWirePro: NZD/USD consolidates overnight gains, but loses momentum


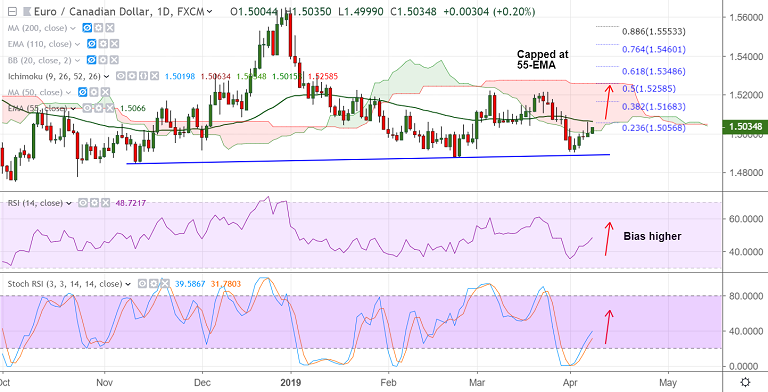
EUR/CAD chart - Trading View
Chart pattern: Falling Triangle pattern
EUR/CAD Technical Analysis: Bias Bullish
- Price has retraced into daily cloud
- Pair has bounced off from near trendline support at 1.4890
- Stochs have rolled over from oversold levels
- RSI is biased higher, 5-DMA has turned
Support levels - 1.4992 (5-DMA), 1.4951 (Nov 23, 2018 low), 1.49
Resistance levels - 1.5066 (55-EMA), 1.5130 (Apr 8 high), 1.5168 (38.2% Fib)
Recommendation: Stay long on break above 55-EMA, SL: 1.50, TP: 1.51/ 1.5130/ 1.5165
For details on FxWirePro's Currency Strength Index, visit http://www.fxwirepro.com/currencyindex.

- News

- Economy

- Central Banks
- Investing
- Research
- Roundups
- Digital Currency
- Insights
- Technical Analysis
- Technology
- Business
- Law
- Health
- Nature
- Fintech
- Science
- Topic
- Opinions
- ©Econometrics LLC . All Rights Reserved.
FxWirePro: EUR/CAD Trade Idea
Monday, April 8, 2019 12:15 PM UTC
Editor's Picks


- Market Data
Most Popular


