


 FxWirePro- Woodies pivot (Major)
  FxWirePro: GBP/USD downtrend loses steam but outlook still bearish
  FxWirePro- Major Crypto levels and bias summary
  GBPJPY Slips After Sterling Weakness, Bears Eye 216
  FxWirePro :USD/JPY eases slightly, remains on bullish path
  FxWirePro: EUR/NZD up trend gains momentum but hurdles ahead
  JPY Action Bias: Bullish Pairs to Watch Out For
  FxWirePro: USD/ZAR uptrend loses steam, remains on bullish path
  FxWirePro: AUD/USD dips after RBA Governor speech
  FxWirePro- Major Pair levels and bias summary
  FxWirePro: USD/CNY dips as yuan firms on improving risk appetite
  FxWirePro: NZD/USD edges lower, remains on back foot
  FxWirePro: NZD/USD gains as U.S.-Iran peace hopes boost risk sentiment
  FxWirePro: USD/CAD positions for another climb, eyes 1.4150 level
  FxWirePro: GBP/AUD downside pressure builds, key support level in focus
  FxWirePro: GBP/NZD gains some ground but bias is still bearish


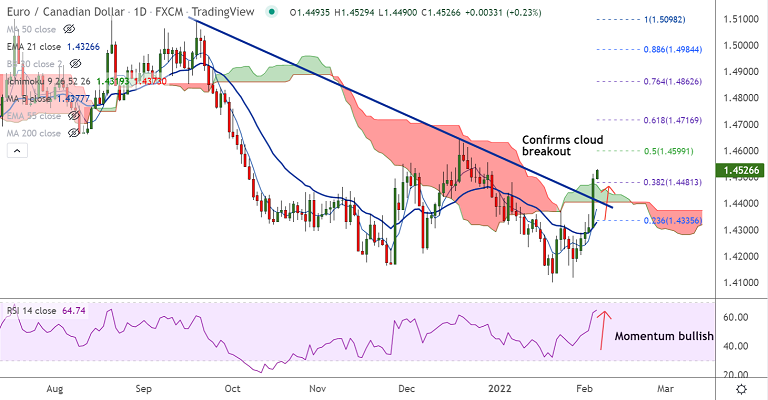
Chart - Courtesy Trading View
Technical Analysis: Bias Bullish
GMMA Indicator
- Minor trend has turned strongly bullish
- Major trend has turned bullish on the intraday charts
Ichimoku Analysis
- Price action has confirmed breakout above the daily cloud
- Chikou span is biased higher, raising scope for further gains
Oscillators
- Stochs and RSI are sharply higher, RSI is above 60 level
- Momentum is strongly bullish
Bollinger Bands
- Bollinger bands are wide spread, suggesting high volatility
Major Support Levels: 1.4459 (110-EMA), 1.4366 (55-EMA), 1.4279 (200H MA)
Major Resistance Levels: 1.4600 (converged 50% Fib and 200-DMA), 1.4646 (Dec 20 2021 high), 1.4716 (61.8% Fib)
Summary: EUR/CAD trades with a strong bullish bias, on track to test 200-DMA at 1.46.


