


 FxWirePro- Woodies pivot (Major)
  FxWirePro: GBP/NZD remains weak, eyes 38.2%fib support
  FxWirePro: GBP/USD rises as soft US data pressures dollar
  Major FX Action Bias & US Market Sentiment: NZD/USD (Extremely Bullish) & AUD/USD (Bullish) Watchlist
  FxWirePro- Major Crypto levels and bias summary
  US Magnificent 7 Stocks Trend Score: Amazon & Microsoft Hit Extreme Bullish (+100) as Meta Drops to -100 — Key Resistance & Support Watchlist
  FxWirePro: AUD/USD gains some ground but outlook is bearish
  FxWirePro: USD/ZAR gains as stronger dollar outweighs upbeat South Africa's trade surplus
  FxWirePro: NZD/USD consolidates overnight gains, but loses momentum
  FxWirePro- Major Crypto levels and bias summary
  FxWirePro: GBP/AUD bears maintain upper hand
  FxWirePro- Woodies pivot (Major)
  Nikkei Surges Past 65,000 on Suspected Yen Weakness: Tech Giants Like Advantest and NEC Lead Explosive Gains
  FxWirePro: GBP/AUD drifts lower after BOE rate decision
  US Magnificent 7 Stocks Trend Score: Amazon & Microsoft Hit Extreme Bullish (+100) as Meta Drops to -100 — Key Resistance & Support Watchlist


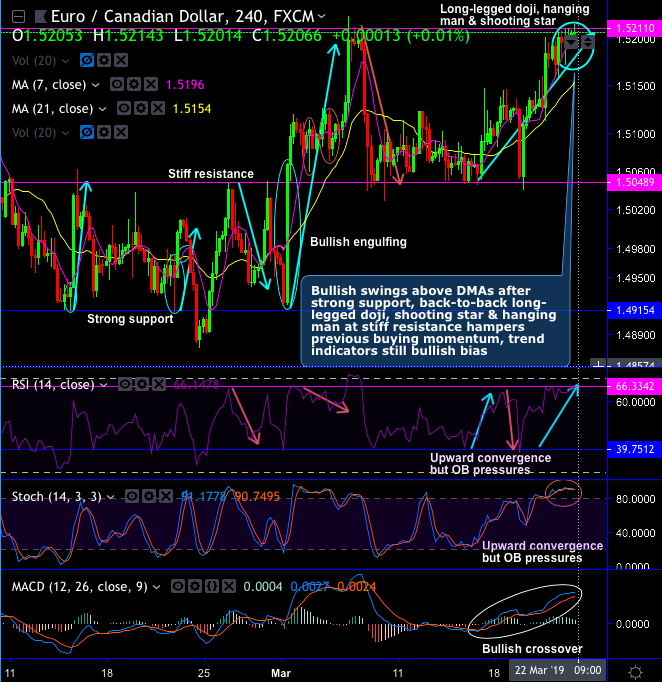
EURCAD minor trend has been little edgy from. Although it has been sensing little overbought pressures at 1.5215 levels, the bullish swings remain well above DMAs after the test of strong support,
The strong supports are seen at – 1.5197, 1.5154 and 1.5048 levels.
The stiff resistances are at – 1.5215, 1.5281 and 1.5585 levels.
Currently, back-to-back long-legged doji, shooting star & hanging man patterns have occurred at the stiff resistance that hampers previous buying momentum, while the trend indicators still bullish bias (refer daily chart).
On a broader perspective, The pair has also formed hammer pattern candles are frequently occurred at 1.51, 1.4938 and 1.4905 levels, these patterns are bullish in nature that are signifying the strength of this pair in the major uptrend, whereas on the contrary, shooting stars have occurred at 1.3970, 1.5209, 1.5127 and 1.5888 levels (refer magnified view of the monthly chart). The pair has been oscillating upwardly between ranges, and this price behavior has been developing ascending channel formation.
Both RSI has shown gaining strength at 48 levels several times in the past and so is the current case.
Whereas fast stochastic curves, which are a leading indicator, is showing the downward convergence to the price slumps. This indicates the shrinking buying momentum. While the lagging indicator (MACD) has been little indecisive showing bearish crossover remaining in bullish trajectory.
Trading tips: Contemplating above technical rationale, at spot reference: 1.5211 levels, it is wise to buy in the money call options (strikes at 1.5150 levels), an in the money call with a very strong delta will move in tandem with the underlying spot move.
Alternatively, we are inclined to a directional position on hedging grounds ahead of data announcements of eurozone PMIs for manufacturing and service sectors and CPI numbers from Canadian side, we advocate initiating shorts in EURCAD futures contracts of April’19 delivery as downside risks are foreseen and simultaneously, add longs of May’19 delivery for the further major downtrend. Thereby, one can directionally position in their FX exposures. The directional implementation of the same trading theme by further allow for a correlation-induced discount in the options trading also if you choose strikes appropriately.
Currency Strength Index: FxWirePro's hourly EUR spot index is flashing at 40 (which is bullish), while hourly CAD spot index was at -64 (bearish) at 08:01 GMT.
For more details on the index, please refer below weblink: http://www.fxwirepro.com/currencyindex


