


 JPY Action Bias: EURJPY and CADJPY Emerge as Extremely Bullish Pairs to Watch
  FxWirePro: AUD/USD dips below lower range, bearish bias increases
  FxWirePro: GBP/AUD drifts lower after BOE rate decision
  FxWirePro: EUR/AUD regains upwards momentum but unable to hold above 50%fib level
  FxWirePro:EUR/NZD gains some upside momentum but still bearish
  FxWirePro: GBP/AUD gains above 1.9200 level , upside pressure builds
  FxWirePro: USD/CAD slips after Fed holds rates steady
  Nikkei Surges Past 65,000 on Suspected Yen Weakness: Tech Giants Like Advantest and NEC Lead Explosive Gains
  FxWirePro- Major Crypto levels and bias summary
  EURUSD Spikes to 1.14306 on Fed Pause as Traders Eye Sell-the-Rally Setup
  FxWirePro: USD/JPY edges higher as focus shifts to BOJ decision
  FxWirePro- Woodies pivot (Major)
  FxWirePro: USD/ZAR firms ahead of Fed interest rate decision
  Buy the Dips on EUR/JPY: Bullish Structure Points to 188 Target Ahead of Fed
  FxWirePro: USD/ CNY hits one-month low,scope for futher downside


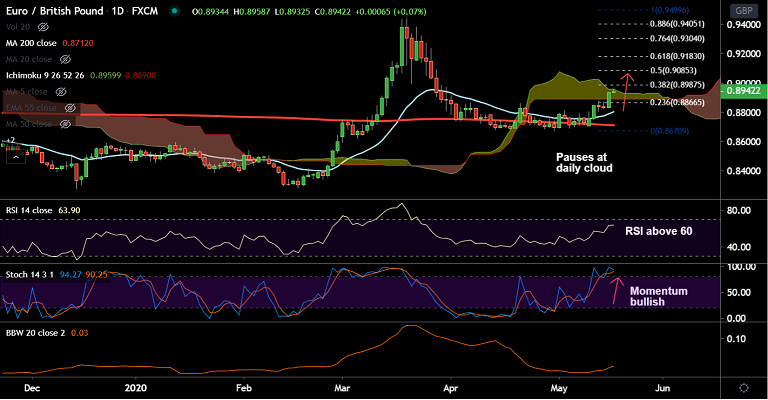
EUR/GBP chart - Trading View
Technical Analysis: Bias Bullish
GMMA Indicator:
- Major Trend: Turning Bullish
- Minor Trend: Strongly Bullish
Ichimoku Analysis:
- Price action is attempting breakout of daily cloud
- Bullish Tenkan Sen crossover over Kijun Sen
Oscillators:
- RSI is above 60 with room to run further
- Stochs are in overbought zone, but no major signs of reversal seen, momentum bullish
Bollinger Bands:
- Bollinger Bands are widening on the daily charts
- Price action is above major moving averages and rising volatility could take the pair higher
High/Low:
- Previous Week High/Low - 0.8939/ 0.8706
- Previous Session High/Low - 0.8939/ 0.8826
Major Support Levels: 0.8879 (5-DMA), 0.8804 (21-EMA), 0.8770 (55-EMA)
Major Resistance Levels: 0.8959 (Cloud top), 0.8987 (38.2% Fib), 0.9085 (50% Fib)
Summary: EUR/GBP has ended consolidation along 200-DMA and has entered into a bull phase. Momentum with the bulls. Price action is hovering around cloud top and breakout above will see jump till 50% Fib retracement at 0.9085.


