


 FxWirePro: USD/CAD runs out of steam but maintains bullish outlook
  FxWirePro- Major Pair levels and bias summary
  FxWirePro- Major Pair levels and bias summary
  FxWirePro: EUR/ AUD gains some ground , but remains on bearish path
  FxWirePro: USD/JPY eases ahead of Fed decision , Intervention risks linger
  FxWirePro: USD/ CNY remains soft ahead of Fed decision
  Major Forex Pairs Action Bias: GBPUSD and AUDUSD Turn Extremely Bearish
  FxWirePro: USD/ZAR firms ahead of Fed interest rate decision
  Buy the Dips on EUR/JPY: Bullish Structure Points to 188 Target Ahead of Fed
  FxWirePro: GBP/USD edges higher as traders await BoE guidance and UK fiscal clarity
  FxWirePro: NZD/USD neutral in the near-term, scope for downward resumption
  FxWirePro- Woodies pivot (Major)
  EURUSD Spikes to 1.14306 on Fed Pause as Traders Eye Sell-the-Rally Setup
  NZD/JPY Flatlines Near 94.60: Will Key Support Reignite the Uptrend?
  FxWirePro: AUD/USD falls after softer-than-expected Australian Q2 CPI
  FxWirePro: USD/CAD slips after Fed holds rates steady


EUR/GBP chart - Trading View
EUR/GBP Spot:
- The pair was trading 0.05% lower on the day at 0.8562 at around 08:25 GMT
- Session high was 0.8568 and low was 0.8554
- The pair closed 0.08% higher on Thursday's trade
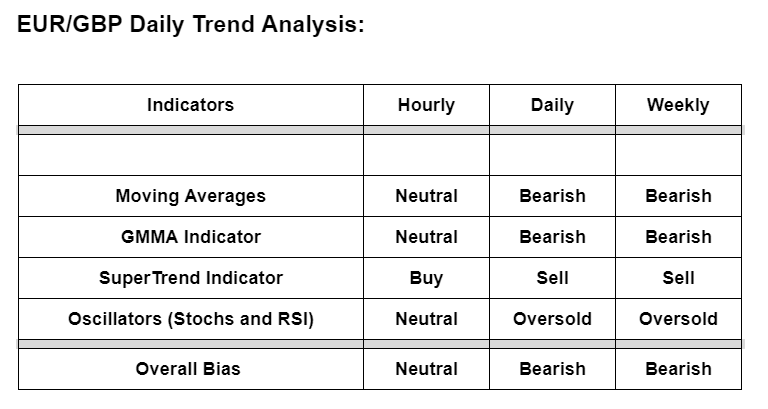
Technical Bias: Bearish
Technical Analysis:
Moving Averages: Price action is below major moving averages and moving averages are biased lower on the daily and weekly charts
GMMA Indicator: Analysis of GMMA indicator shows major and minor trend are bearish on daily and weekly charts
SuperTrend Indicator: SuperTrend indicator gives a Sell signal on daily and weekly charts. Any upside on the hourly charts could provide a good opportunity for entry
Oscillators (Stochs and RSI): Oversold conditions on daily and weekly charts warrants caution for possibility of pullbacks, however, no major signs of retrace are seen
Support levels - 0.8538 (Feb 24th low), 0.8488 (May 2019 low), 0.8415 (88.6% Fib)
Resistance levels - 0.8601 (200H MA), 0.8638 (21-EMA), 0.8643 (5W MA)
Summary: EUR/GBP trades with a major bearish bias. Oversold oscillators are a cause of concern. The pair is showing no major signs of retrace. However, price action is moving away from lower Bollinger band. Watch out for retrace above 200H MA for more upside. 21-EMA should cap any upside. Breakout at 21-EMA could change near-term dynamics.


