


 EUR/USD Bounces from Monthly Low, But Bearish Pressure Remains
  FxWirePro: NZD/USD edges lower, remains on back foot
  JPY Action Bias: USDJPY Emerges as the Clear Bullish Pair to Watch Amid Mixed Crosses
  FxWirePro: USD/CAD gaining momentum for a move towards 1.4200 level
  FxWirePro- Woodies pivot (Major)
  FxWirePro: USD/CAD runs out of steam but maintains bullish outlook
  Crypto Action Bias: ETHUSD Stands Out as the Bullish Pair to Watch
  FxWirePro: GBP/USD edges higher as traders await BoE guidance and UK fiscal clarity
  FxWirePro: USD/ZAR uptrend loses steam, remains on bullish path
  FxWirePro: USD/ CNY remains soft ahead of Fed decision
  FxWirePro: NZD/USD neutral in the near-term, scope for downward resumption
  FxWirePro: GBP/AUD downside pressure builds, key support level in focus
  FxWirePro: AUD/USD dips after RBA Governor speech
  NZDJPY Pullback: Sell Rallies Toward 93.30 as Yen Weakness Eases
  FxWirePro: GBP/AUD gains some upside momentum but still bearish


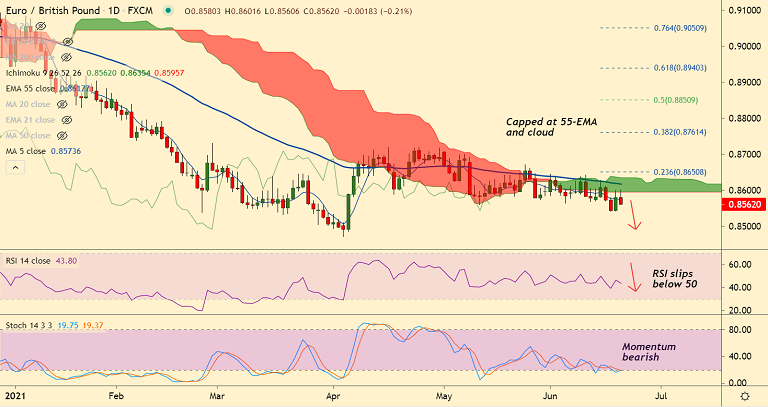
EUR/GBP chart - Trading View
Technical Analysis: Bias Bearish
- EUR/GBP edges lower from session highs at 0.8601
- Upside remains capped at daily cloud
- The pair has ignored previous session's Doji formation
- Price action hovers around 76.8% Fib, bias lower
- Momentum studies are bearish, RSI is below the 50 mark
- Recovery attempts capped at 200H MA
Support levels - 0.8559 (76.8% Fib), 0.8544 (Lower BB), 0.85 (Trendline)
Resistance levels - 0.8573 (5-DMA), 0.8591 (21-EMA), 0.8617 (55-EMA)
Summary: EUR/GBP is extending gradual grind lower. The pair has ignored Doji formation on the previous week's candle and is extending downside. Scope for test of trendline support at 0.85. Break below will accentuate downside.


