


 FxWirePro: GBP/USD downtrend loses steam but outlook still bearish
  FxWirePro: EUR/NZD firms after ECB holds rates steady at 2.25%
  FxWirePro: GBP/AUD bears maintain upper hand
  FxWirePro: USD/ZAR retreats slightly but bias is bullish
  FxWirePro: EUR/AUD neutral in the near term, scope for downward resumption
  Crypto Bias Report: Trend Signals and Top Bullish Picks
  FxWirePro- Major Crypto levels and bias summary
  NZDJPY Bullish Dip-Buy Setup: 93.60 Support Unlocks Path to 97
  FxWirePro: GBP/NZD downside pressure builds, key support levels in focus
  Major Pairs Action Bias: USDCHF Emerges Extremely Bullish as EURUSD and GBPUSD Turn Deeply Bearish
  FxWirePro- Major Pair levels and bias summary
  FxWirePro- Woodies pivot (Major)
  FxWirePro- Woodies pivot (Major)
  JPY Action Bias: USDJPY, EURJPY, and CADJPY Emerge as Top Extremely Bullish Picks
  FxWirePro: USD/CNY edges higher but bulls lack punch
  EUR/USD Slides After ECB Hold, Bearish Technicals Favor Rally Fades


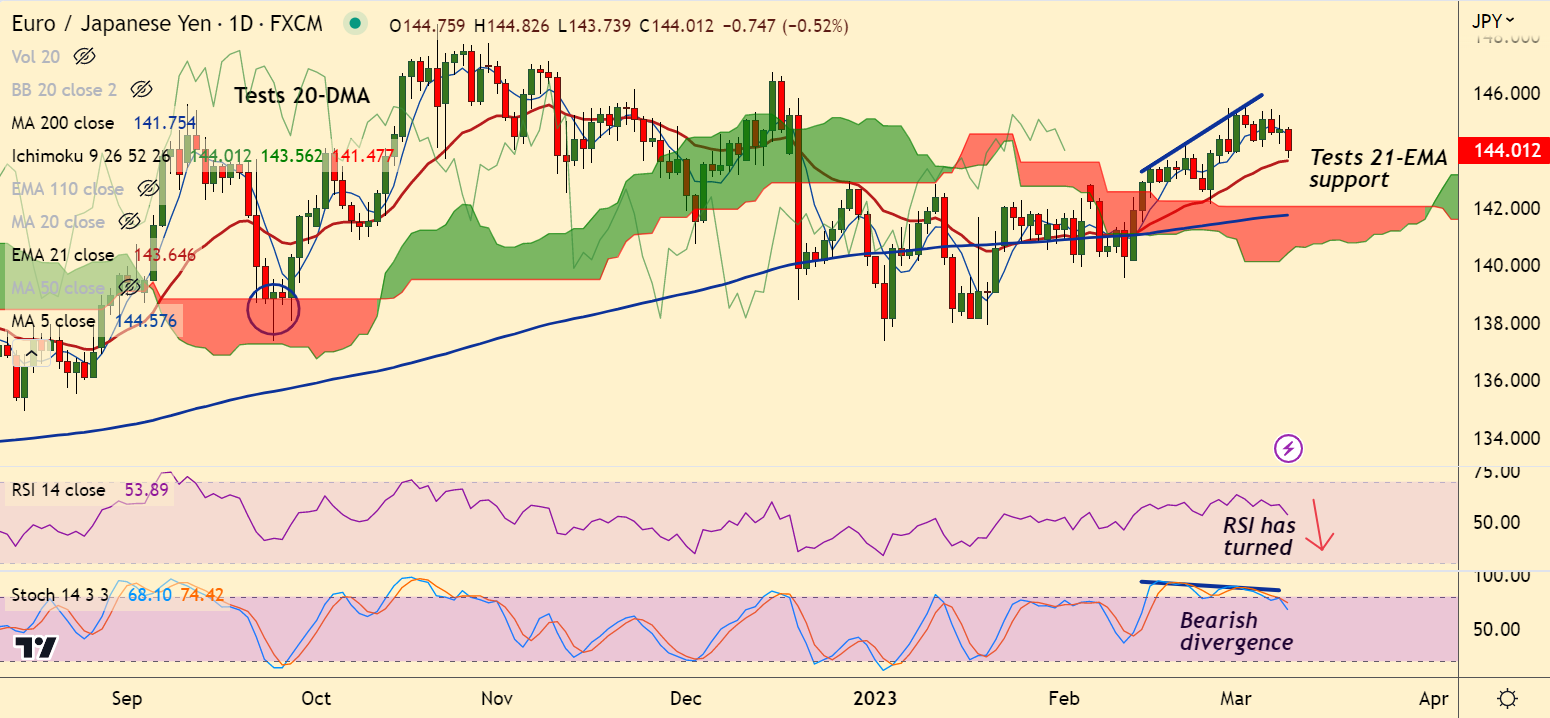
Chart - Courtesy Trading View
Technical Analysis:
- EUR/JPY was trading 0.51% lower on the day at 144.03 at around 12:20 GMT
- The pair has slipped below 200H MA and GMMA indicator has turned bearish on the intraday charts
- MACD is on verge of bearish crossover on signal line, Chikou span is biased lower
- Bearish Stochastics divergence keeps the pair under pressure
- Stochs and RSI are biased lower, Stochs are on verge of bearish rollover from overbought levels
Support levels - 143.64 (21-EMA), 142.77 (55-EMA)
Resistance levels - 144.57 (5-DMA), 144.70 (200H MA)
Summary: EUR/JPY is struggling to extend 'Symmetric Triangle' breakout. The pair is pivotal at 21-EMA support. Break below will drag the pair lower.


