
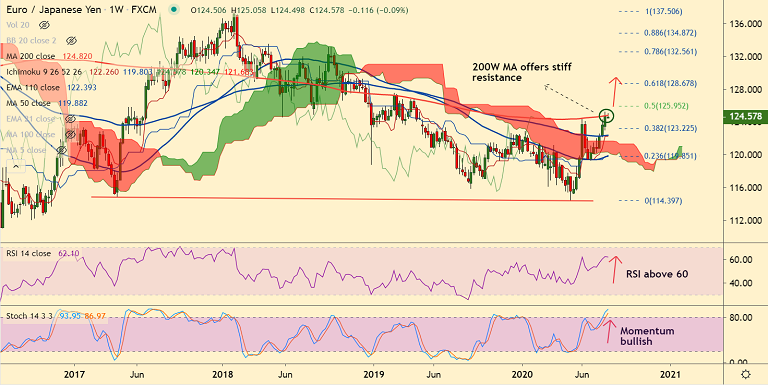
EUR/JPY chart - Trading View
Technical Analysis: Bias Bullish
GMMA Indicator
- Major and minor trend are strongly bullish on the daily charts
- On the weekly charts minor trend is bullish, while major trend is turning bullish
Ichimoku Analysis
- Price action is above cloud on the daily and weekly charts
- Chikou span has turned flat
Oscillators
- Stochs and RSI are in overbought territory, but do not show any signs of weakness
- Scope for rollover from overbought levels
Bollinger Bands
- Bollinger bands are widening on the daily and weekly charts
- Volatility is high and rising
Major Support Levels: 124.02 (5-DMA), 123.22 (38.2% Fib), 122.96 (21-EMA)
Major Resistance Levels: 124.82 (200W MA), 125.95 (50% Fib), 128.67 (61.8% Fib)
Summary: EUR/JPY trades with a strong bullish momentum. The pair has paised at stiff resistance at 200W MA. Momentum is bullish and volatility is rising. Decisive break above 200W MA will propel the pair higher. Scope for test of 61.8% Fib at 128.67.


