


 FxWirePro: GBP/AUD downside pressure builds, key support level in focus
  EUR/JPY Bulls Hold the Line Above 185: Eyes Locked on 188 Breakout
  FxWirePro- Major Pair levels and bias summary
  FxWirePro- Major Crypto levels and bias summary
  FxWirePro: EUR/AUD downward momentum remains in place
  FxWirePro: USD/ZAR sell bias remains below key resistance zone
  FxWirePro- Major Crypto levels and bias summary
  Pound-Yen Roars Back Above 214: Bulls Reload for 216–217 Charge on Dip-Buying Setup
  FxWirePro: EUR/ NZD dips below lower range, bearish bias increases
  Aussie Yen Breaks 114 Barrier: Bulls Lock Horns With Resistance, Eyes on 115 Summit
  FxWirePro: USD/CAD slips as Canadian dollar firms on hopes for US-Iran ceasefire deal
  FxWirePro: GBP/USD recovers some ground but bears are not done yet
  FxWirePro- Major Crypto levels and bias summary
  FxWirePro: NZD/USD gains as hawkish RBNZ comments boost Kiwi dollar
  FxWirePro: USD/ZAR slips as SARB delivers surprise rate hike
  USD/CHF Smashes Higher to 0.7899 on Dollar Dominance—Bulls Bet on 0.7865 Dips for 0.8000 Breakout
  Ethereum Tumbles Below $2K: Bears Eye $1,700 as All Key EMAs Flip Red


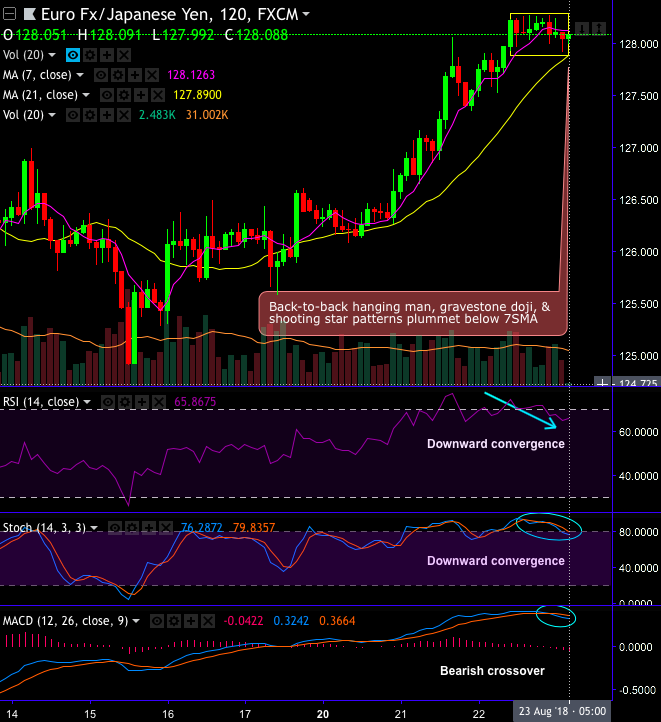
EURJPY chart and candlestick pattern formed – Back-to-back hanging man, gravestone doji and shooting star patterns occur at peaks of levels (refer 2H chart) that plummet prices below 7SMAs, consequently, the overbought momentum is observed.
The same patterns have occurred even on monthly terms at 61.8% Fibonacci retracement levels, shooting star 132.336 and hanging man pattern at 135.157 levels (on monthly terms).
While both momentum and trend indicators signal weakness.
As stated previously in our write-up, the intermediate trend after the bearish pattern candles has resumed major downtrend, slides below EMAs & head towards 38.2% Fibonacci levels of 2014 December highs & 2016 June lows, both leading & lagging indicators signal weakness (refer monthly chart).
Trade tips: On trading perspective, at spot reference: 128.067 levels, it is advisable to execute tunnel spreads, use upper strikes at 128.290 levels and lower strikes at 127.886 levels, the strategy is likely to fetch leveraged yields as long as underlying spot FX keeps dipping but remains above lower strikes on expiration.
Alternatively, as ECB rhetoric continued to evolve dovish fashion, we uphold shorts in futures contracts of mid-month tenors with a view to arresting potential dips.
Currency Strength Index: FxWirePro's hourly EUR spot index is flashing at 116 levels (which is bullish), while hourly JPY spot index was at -105 (bearish) while articulating at 05:12 GMT. For more details on the index, please refer below weblink:


