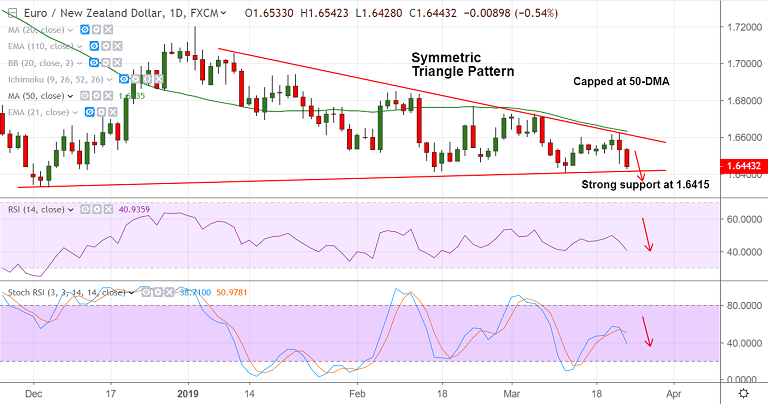
EUR/NZD chart - Trading View
EUR/NZD Technical Analysis: Bias Bearish
Chart Pattern: Symmetric Triangle
- Price action below cloud and major moving averages
- Stochs and RSI are biased lower
- Guppy's Multiple Moving Average shows major trend is bearish
- Upside was rejected shy of 50-DMA
- Break below triangle base will see dip till 200W SMA at 1.6355
- Violation at 200W SMA will accentuate weakness
Support levels - 1.6415 (triangle base), 1.6355 (200W SMA), 1.6334 (Dec 4 low)
Resistance levels - 1.65, 1.6533 (5-DMA), 1.66 (triangle top)
Recommendation: Stay short on break below triangle base, SL: 1.6535, TP: 1.6355/ 1.6140
For details on FxWirePro's Currency Strength Index, visit http://www.fxwirepro.com/currencyindex.