


 FxWirePro- Major Pair levels and bias summary
  FxWirePro- Major European Indices
  FxWirePro: USD/CAD recovers slightly but bearish outlook persists
  Bitcoin’s Volatile Reset: ETFs Rebound as Bulls Eye USD 80,000 Milestone
  FxWirePro: GBP/NZD up trend gains some momentum but hurdles ahead
  FxWirePro:NZD/USD uptrend loses momentum but bullish setup remains
  FxWirePro: EUR/CAD gains ground on prospects of resumed energy flows
  FxWirePro: GBP/AUD positions for another drop, eyes 1.8900level
  FxWirePro- Woodies Pivot(Major)
  FxWirePro: USD/ZAR edges lower ,investors remain on edge
  FxWirePro: AUD/USD retreats slightly but trend is still bullish
  NZDJPY Bulls Charge Toward 95.00: Safe-Haven Exodus Drives Kiwi Rally
  FxWirePro: USD/ZAR recovers slightly but trend is still bearish
  Ethereum Consolidates: Bullish Technicals Point to a Potential $3,000 Breakout
  FxWirePro: EUR/AUD under pressure as key support gives way
  FxWirePro- Major Crypto levels and bias summary
  FxWirePro: USD/CNY partially recovers early session losses


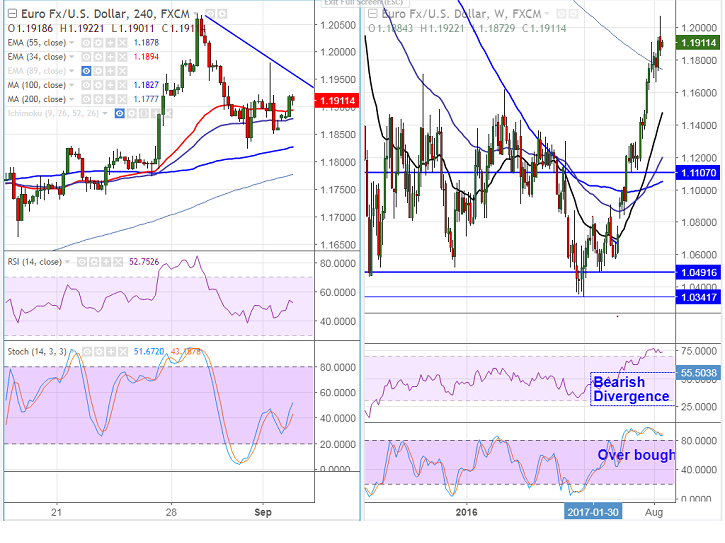
- EURUSD hits 27- month high of 1.20700 in previous week and started to decline from that level. The pair dipped till 1.18230 and shown a minor jump till 1.19795 after weaker than expected U.S jobs data.
- The pair faces major trend line resistance at 1.19600 (trend line joining 1.20700 and 1.19795) and any break above will take the pair to next level till 1.2000/1.2070 (161.8% fibo).
- In the weekly chart the pair has formed bearish divergence and stochastic also shows over bought.
- On the lower side, any break below 1.18170 (21- day EMA) will drag the pair to next level till 1.17500 (200- W MA)/1.1700/1.16620 (Aug 17th 2017 low).
It is good to sell on rallies around 1.1955-1.19600 with SL around 1.2020 for the 1.18200/1.1750


