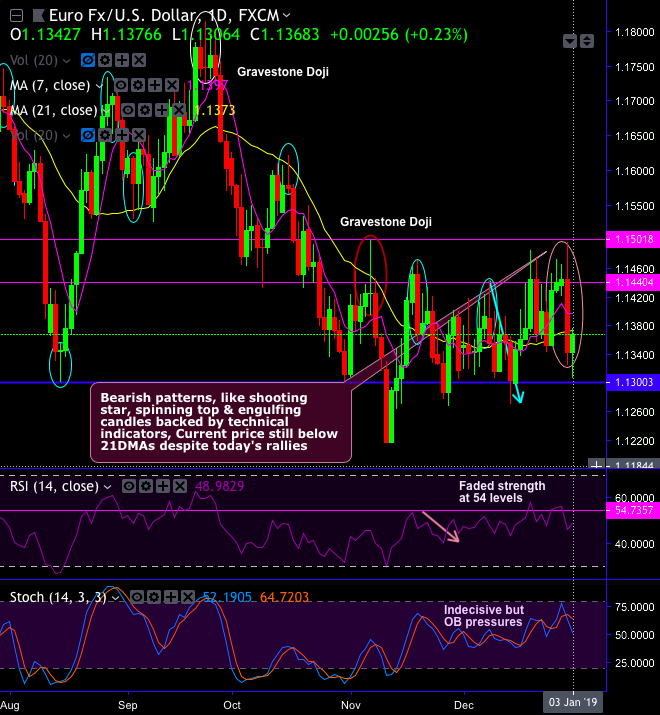
Technical Chart and Candlestick Pattern: Year-2018 has been unpleasant for EURUSD. We bid New Year wishes for bears with reiteration of EURUSD’s interim mild upswings that are not backed by the technical indicators as shooting star, spinning top and bearish engulfing formations at 1.1440, 1.1444 and 1.1342 levels respectively hamper previous bullish sentiments.
The current upswings are restrained below 21DMAs. The price dips seem to be likely as RSI shows faded strength at this juncture that indicates overbought pressures (refer daily chart).
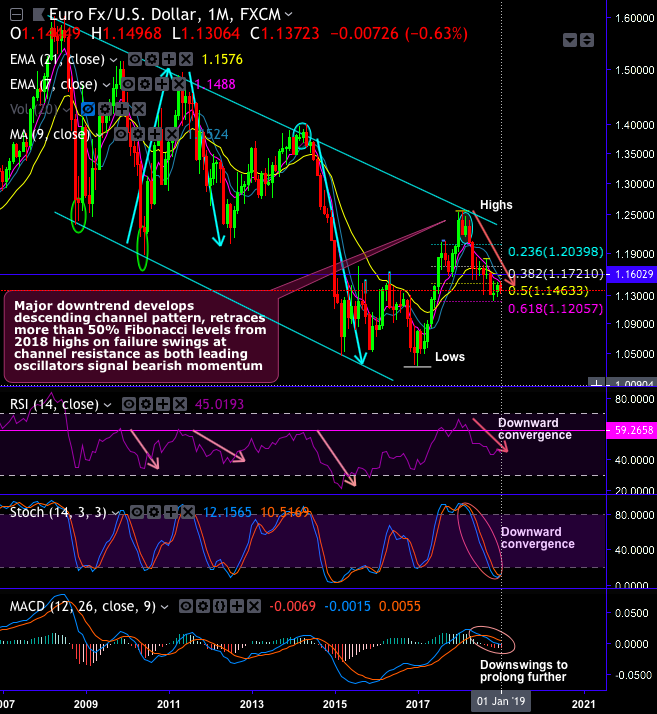
While the major downtrend has been sliding through descending channel pattern which is bearish in nature, where bears retrace more than 50% Fibonacci levels from 2018 highs on the failure swings at channel resistance as both leading oscillators signal bearish momentum (refer monthly chart). Bearish patterns that were explained above are developing descending channel.
Overall, we could foresee more slumps on the cards as the current price still remains well below 21-EMAs despite recent time’s rallies, bears are most likely to extend 1 and half year lows and retrace 61.8% Fibonacci levels of January 2018 highs (i.e. 1.2612) and January 2017 lows (i.e. 1.0371 levels) (refer monthly chart).
Both leading oscillators (RSI and stochastic curves) and both trend indicators (DMAs, EMAs & MACD), on this timeframe, have been signaling intensified bearish momentum and downtrend continuation respectively.
Trade tips: At spot reference: 1.1365 levels, contemplating above technical rationale, one can execute options strategy with boundary strikes. Such exotic option with upper strikes at 1.1395 and lower strikes at 1.1324 levels that’s been unbiased strategy but to favor slightly the bearish sentiments.
Alternatively, shorting futures of mid-month tenors are advocated with a view of arresting further potential slumps. Writers in a futures contract are expected to maintain margins in order to open and maintain a short futures position.
Currency Strength Index: FxWirePro's hourly EUR spot index is inching towards -31 levels (which is mildly bearish), while hourly USD spot index was at 37 (mildly bullish) while articulating (at 07:59 GMT).
For more details on the index, please refer below weblink: http://www.fxwirepro.com/currencyindex