


 EURUSD Spikes to 1.14306 on Fed Pause as Traders Eye Sell-the-Rally Setup
  FxWirePro: GBP/USD edges lower ahead of Fed policy verdict
  FxWirePro: AUD/USD falls after softer-than-expected Australian Q2 CPI
  Major Forex Pairs Action Bias: GBPUSD and AUDUSD Turn Extremely Bearish
  FxWirePro: USD/JPY eases ahead of Fed decision , Intervention risks linger
  FxWirePro- Major Pair levels and bias summary
  FxWirePro: NZD/USD neutral in the near-term, scope for downward resumption
  Buy the Dips on EUR/JPY: Bullish Structure Points to 188 Target Ahead of Fed
  FxWirePro: GBP/AUD gains some upside momentum but still bearish
  FxWirePro- Major Pair levels and bias summary
  Crypto Action Bias: ETHUSD Stands Out as the Bullish Pair to Watch
  FxWirePro: USD/ZAR retreats but trend is still bullish
  FxWirePro: GBP/USD edges higher as traders await BoE guidance and UK fiscal clarity
  EUR/JPY Holds Bullish Bias as Euro Extends Recovery


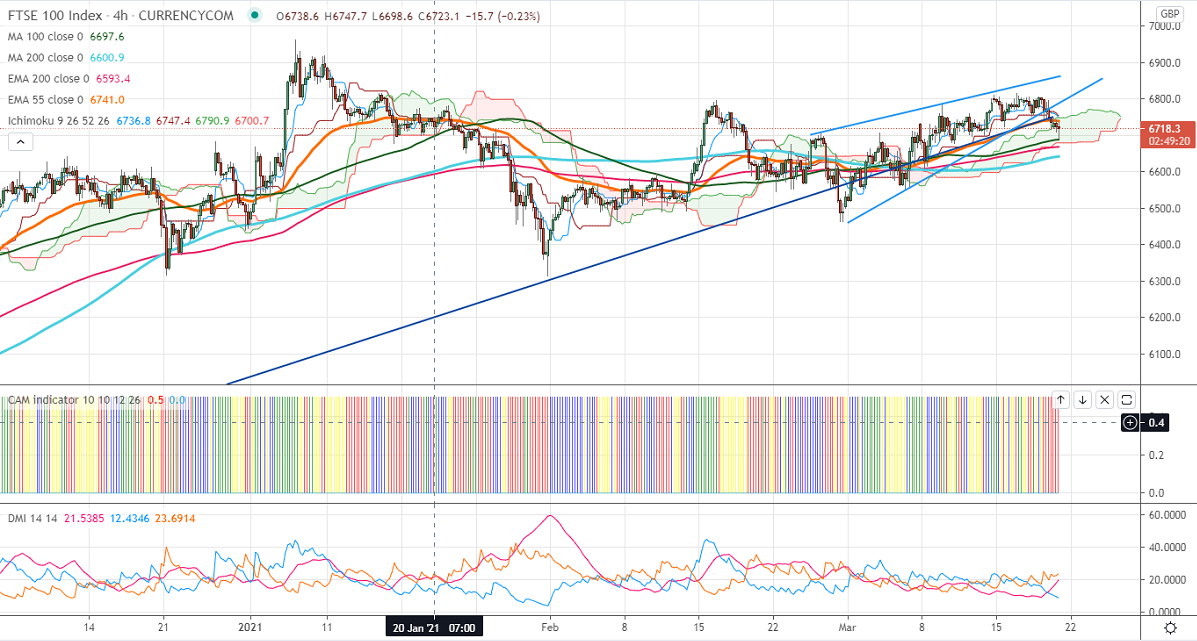
Ichimoku Analysis (4- Hour chart)
Tenken-Sen- 6757
Kijun-Sen-6761
FTSE100 breaks trend line support after a long consolidation. The surge in US bond yield is putting pressure on global stock markets. The US 10- year yield hits a 13-month high despite the dovish Fed. The Bank of England has kept its rates and bond-buying program unchanged as expected. It ha said that the central bank is not worried about rising bond yield. The shortage of COVID vaccine and US-China tensions also dragging FTSE down. It hits an intraday low of 6693 and currently trading around 6713.
The near-term resistance to be watched is 6820; any violation above will take the index till 6890/6963. Significant bullish trend continuation only if it crosses 7000. On the lower side, near-term support is around 6670, and any violation below targets 6600/6549.
Indicator (1 Hour chart)
CAM indicator – Bearish
Directional movement index – Bearish
It is good to sell on rallies around 6845-50 with SL around 6900 for the TP of 6600.


