
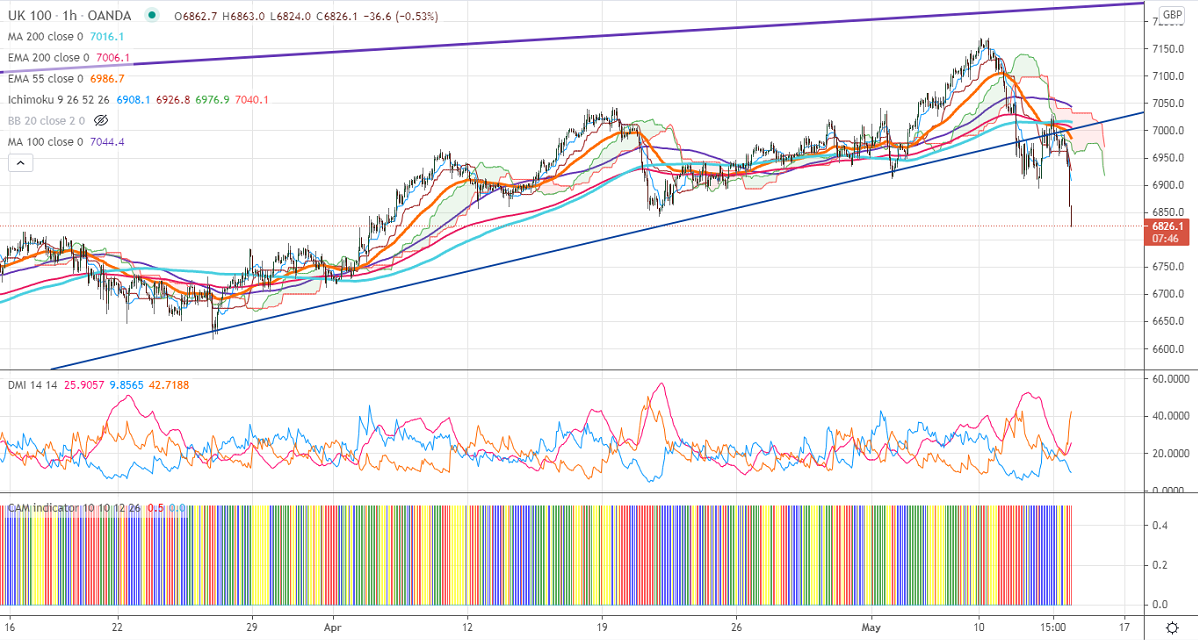
Ichimoku Analysis (Hourly chart)
Tenken-Sen- 6926
Kijun-Sen-6945
FTSE100 continues to trade lower for fourth consecutive days and lost more than 350 points. The US market especially Dow Jones declined more than 473 points yesterday, the biggest loss since Feb on surge in US inflation. The US CPI rose by 0.8% in Apr much better than the forecast of 0.2%. The annual inflation surged to 4.2% in Apr from 2.6% in Mar, the highest level in 13 years. The jump in inflation might force Fed to taper its stimulus. FTSE100 should break above channel resistance 7220 for further bullishness. The FTSE100 hits a fresh pandemic high of 7169 and currently trading around 6834.
The near-term resistance to be watched is 6910 any break above will take the index till 6960/7000/7030. Significant bullish trend continuation only if it crosses 7200. On the lower side, near-term support is around 6820, and any violation below targets 6778/6730/6700/6677.
Indicator (Hourly chart)
CAM indicator – Bearish
Directional movement index – Bearish
It is good to sell on rallies 6900-6910 with SL around 7030 for the TP of 6680.


