
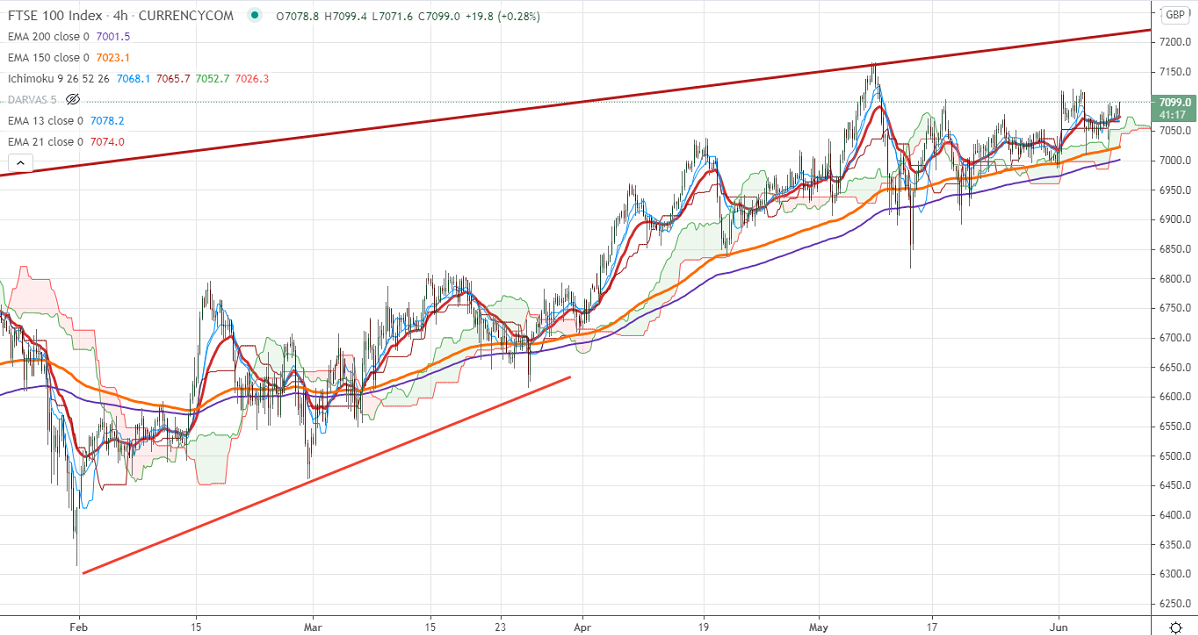
Ichimoku Analysis (Daily chart)
Tenken-Sen- 7054
Kijun-Sen-6992
FTSE100 has shown a minor pullback from a low of 7037 as housing stocks jumped on the upbeat Halifax price index. It came at 1.3%less than the forecast of 1%. The delay in reopening of lockdown due to the spread of the Indian corona variant is also putting pressure on the index. The US indices have closed mixed with Dow jones lost nearly 0.36%. FTSE100 should break above channel resistance 7230 for further bullishness. The FTSE100 hits an intraday high of 7099 and currently trading around 7098.60.
The near-term resistance to be watched is 7125 any break above will take the index till 7170/7220. Significant bullish trend continuation only if it closes above 7200. On the lower side, near-term support is around 7020, and any violation below targets 6985/6920/6900/6820.
Indicator (Daily chart)
CAM indicator – Bullish
Directional movement index – Neutral
It is good to sell on rallies 7170-75 with SL around 7240 for the TP of 6820.


