Home / Technicals / Article Technicals
Add as a preferred source on Google FxWirePro: FTSE100 forms double to pin weekly chart, good to sell on rallies Pattern Formed – Double Top FTSE100 retreated once again after jumping till 7129 in the previous week. It is currently trading around 6989. In the weekly chart, it has formed a double top around 7130 and any slight bulli…
By FxWirePro Team Oct 17, 2016, 8:03 AM UTC
Image from the original EconoTimes article Read the original article
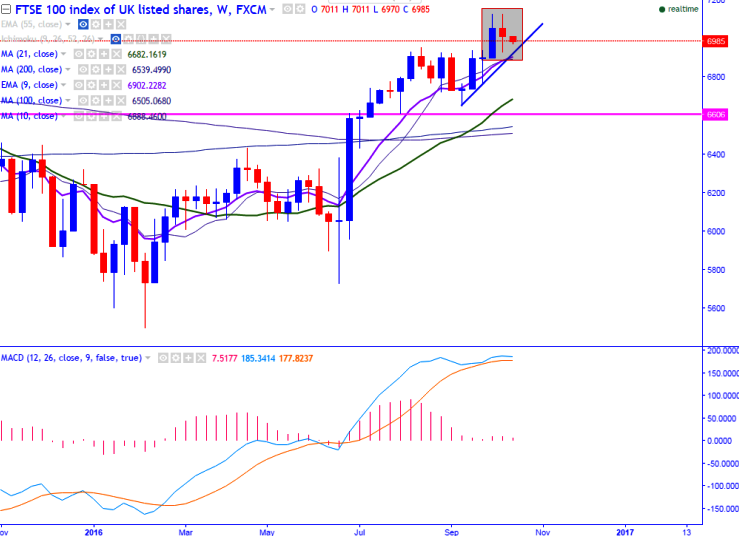
Pattern Formed – Double Top
FTSE100 retreated once again after jumping till 7129 in the previous week. It is currently trading around 6989.
In the weekly chart, it has formed a double top around 7130 and any slight bullishness can be seen only above that level.
Any break above 7130 will take the index to next level till 7223 (161.8% retracement of 7129 and 6928)/7300.
On the lower side, any break below 6950 (21- day MA) will drag the index down till 6880 (9- W EMA)/6839 (61.8% retracement of 6646 and 7130).
It is good to sell on rallies around 7050-60 with SL around 7131 for the TP of 6950/6840
Technicals EURUSD - Levels to watch - 1.1100 GBPUSD Levels to watch - 1.3180 USDCHF Levels to watch - 0.8365 USDCAD - Levels to watch - 1.4300 AUDUSD - Levels to watch - 0.7000 NZDUSD - Levels to watch - 0.5560
By FxWirePro Team Oct 15, 2026, 3:20 AM UTC
Technicals EURUSD - Levels to watch - 1.100 GBPUSD Levels to watch - 1.3180 USDCHF Levels to watch - 0.8400 USDCAD - Levels to watch - 1.4300 AUDUSD - Levels to watch - 0.7000 NZDUSD - Levels to watch - 0.5560
By FxWirePro Team Oct 15, 2026, 3:17 AM UTC
Technicals JPY Major Pair Currency Score: USDJPY, GBPJPY and AUDJPY Extremely Bearish
By FxWirePro Team Oct 15, 2026, 2:34 AM UTC