


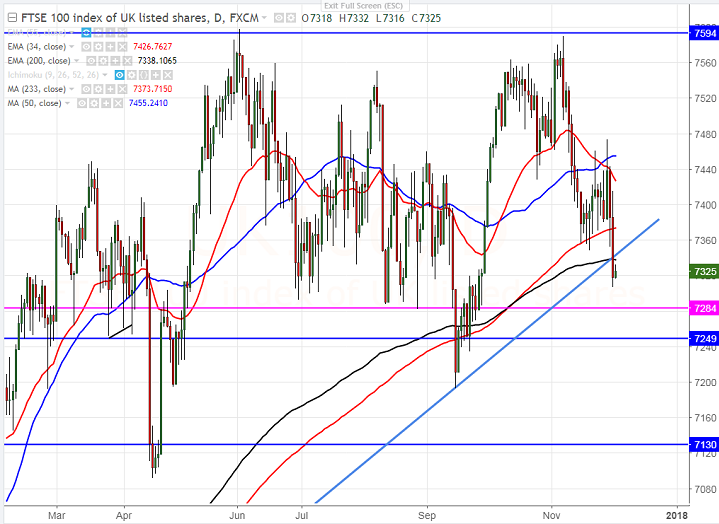
- Chart pattern – Double top
- Major support- 7338-7340 (trend line joining 6789 and 7283).
- FTSE100 is trading weak for the past two days after showing a minor recovery till 7473. The index breaks major support 7340 level and closed slightly below trend line support. The index dipped till 7316 and is currently trading around 7329.
- The index’s short term support is around 7340-7336 (61.8% retracement of 7193 and 7590 and 200- day EMA) and any close below will drag the index down till 7282/7193. Any convincing break below 7190 confirms long term trend reversal, a decline till 7000 is likely.
- The near term resistance is around 7498 (61.8% retracement of 7590 and 7348) and any break above will take the index till 7550/7600.
- Overall bullish continuation only above 7600.
It is good to sell on rallies around 7375-7380 with SL around 7475 for the TP of 7195/7150.


