


 FxWirePro: GBP/NZD gains some ground but bias is still bearish
  FxWirePro- Major Pair levels and bias summary
  FxWirePro- Major Crypto levels and bias summary
  FxWirePro- Major Pair levels and bias summary
  FxWirePro: GBP/AUD gains some upside momentum but still bearish
  FxWirePro: EUR/ AUD gains some ground , but remains on bearish path
  FxWirePro : USD/JPY holds relatively bid on 163 ahead Of FOMC,BoJ meetings
  NZDJPY Pullback: Sell Rallies Toward 93.30 as Yen Weakness Eases
  FxWirePro: GBP/USD edges higher as traders await BoE guidance and UK fiscal clarity
  FxWirePro: USD/CAD gaining momentum for a move towards 1.4200 level
  FxWirePro: NZD/USD edges lower, remains on back foot
  EUR/JPY Holds Bullish Bias as Euro Extends Recovery
  FxWirePro: GBP/NZD maintains bersish bias with focus on 2.2900 level
  Major Pairs Action Bias: USDCAD and USDCHF Stand Out as Extremely Bullish While GBPUSD and NZDUSD Turn Extremely Bearish
  FxWirePro- Woodies pivot (Major)
  AUDJPY Weakness Deepens: Sell Rallies Toward 112 as Aussie Dollar Falters


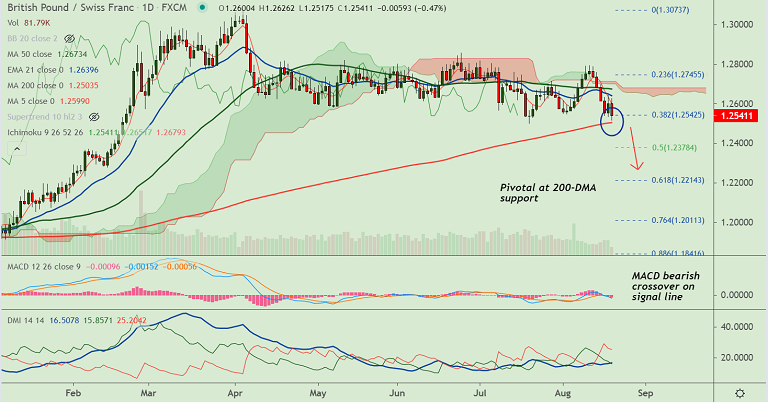
GBP/CHF chart - Trading View
Technical Analysis: Bias Bearish
- Price action is below cloud and is just shy of 200-DMA support
- GMMA indicator is showing a bearish shift in the near-term trend
- Momentum indicators are strongly bearish, Stochs and RSI are sharply lower
- Volatility is high and rising as evidenced by widening Bollinger bands
- MACD is below zero and a bearish MACD line crossover on signal line adds to the downside bias
Support levels - 1.2503 (200-DMA), 1.2467 (55-EMA), 1.2378 (50% Fib)
Resistance levels - 1.2598 (5-DMA), 1.2630 (110-EMA), 1.2661 (55-EMA)
Summary: GBP/CHF trades with a bearish bias. Price action is pivotal at 200-DMA support. Break below will see dip till 50% Fib at 1.2378. Bearish invalidation only above daily cloud.


