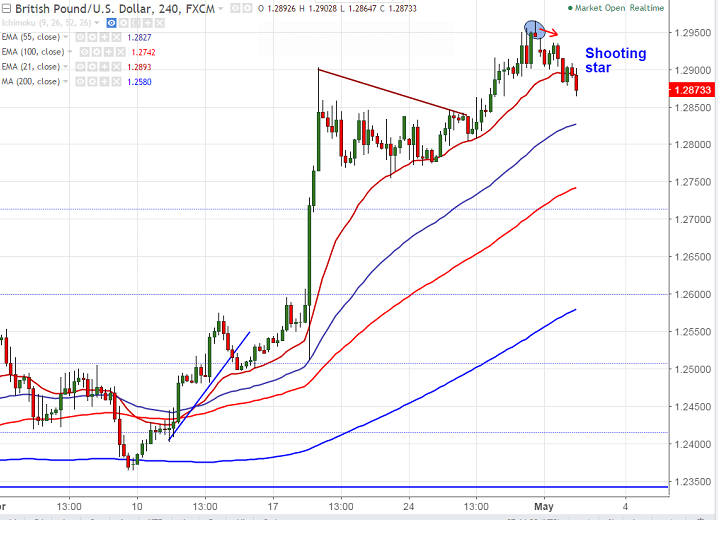
FxWirePro: GBP/USD forms shooting star, dip till 1.2750 likely
Candlestick pattern formed – Shooting star (4 H Chart). GBP/USD hits high of 1.29648 on Apr 28th 2017 and closed slightly below 1.2900 level yesterday. The pair has shown a some sort of profit booking after jumping conti…
Candlestick pattern formed – Shooting star (4 H Chart).
GBP/USD hits high of 1.29648 on Apr 28th 2017 and closed slightly below 1.2900 level yesterday. The pair has shown a some sort of profit booking after jumping continuously form the low of 1.23650.
Market awaits UK PMI data which is to be released for further direction.
The pair has broken minor support of 1.2885 (4H Kijun-Sen) and declined till 1.28699 at the time of writing. Intraday trend is weak as long as resistance 1.29650 holds. Any break below 4H kijun –sen confirms minor weakness, decline till 1.27500 likely.
On the higher side, any break above 1.3000 will take the pair to next level till 1.3030.
It is good to sell on rallies around 1.28850-1.2890 with SL around 1.2965 for the TP of 1.2805/1.2755.