


 FxWirePro: GBP/NZD gains some upside momentum but still bearish
  FxWirePro: USD/ZAR slips as rand gains on U.S.-Iran developments
  FxWirePro- Major Crypto levels and bias summary
  FxWirePro: USD/CAD retreats slightly but trend is still bullish
  FxWirePro:USD/JPY hovers near 40-year peak,intervention fears linger
  NZDJPY Pulls Back on Kiwi Weakness: Buy Dips at 94.40 Targeting 97
  FxWirePro: USD/CAD retains bid tone,eyes 1.4200 level
  FxWirePro: GBP/AUD downtrend loses steam but outlook still bearish
  FxWirePro: AUD/USD bulls struggles as upside momentum fades
  FxWirePro: USD/CNY gains some upside momentum but bias still bearish
  ETHUSD Breaks Above $1900 as Bulls Eye $2300 and Beyond
  FxWirePro: EUR/ AUD downtrend loses steam, remains on bearish path
  FxWirePro- Woodies pivot (Major)
  GBPJPY Weakens on Soft UK CPI: Sell Below 217.80 Targeting 216.40
  FxWirePro: GBP/AUD dips amid heightened Geopolitical concerns
  FxWirePro- Woodies pivot (Major)


 - EconoTimes)


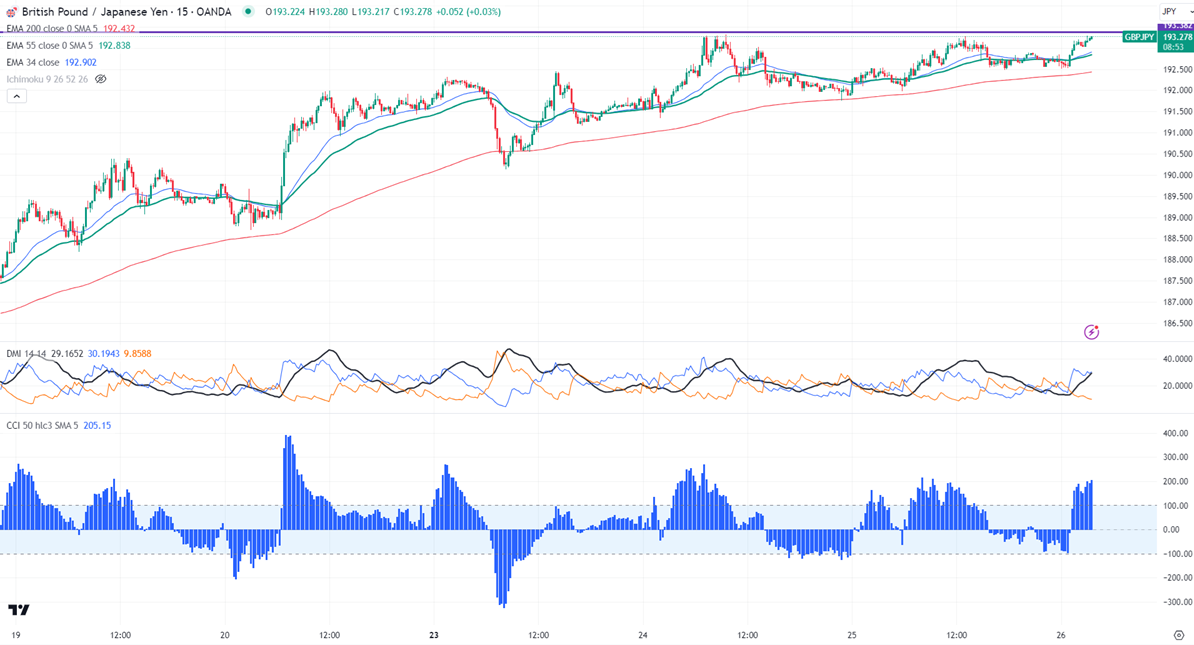
GBPJPY trading in a narrow range between 191.76 and 193.32 in the past two days. It hit a low of 192.51 at the time of writing and is currently trading around 193.23.
Intraday trend is bullish as long as support 192.40 holds.
Technicals (15 min chart)
The pair is trading above short-term 34,55 EMA (190.23 and 191.72) and long-term 200 EMA (191.51) in the 15-minute chart.
The near-term resistance is around 193.32, a breach above targets 193.70/194.14 The immediate support is at 192.80, any violation below will drag the pair to 192.40/192/191.70.
Indicator (15 min chart)
CCI (50)- Bullish
Average directional movement Index - Bullish. All indicators confirm a bullish trend.
It is good to buy above 193.32 with SL 192.80 for a TP of 194.15/194.50.


