


 FxWirePro: GBP/AUD gains above 1.9200 level , upside pressure builds
  FxWirePro- Woodies pivot (Major)
  FxWirePro- Major Pair levels and bias summary
  EURUSD Spikes to 1.14306 on Fed Pause as Traders Eye Sell-the-Rally Setup
  FxWirePro: GBP/AUD drifts lower after BOE rate decision
  Nikkei Surges Past 65,000 on Suspected Yen Weakness: Tech Giants Like Advantest and NEC Lead Explosive Gains
  Major FX Action Bias & US Market Sentiment: NZD/USD (Extremely Bullish) & AUD/USD (Bullish) Watchlist
  FxWirePro : GBP/NZD strongly bearish despite upside attempts
  FxWirePro:USD/JPY climbs back above 160.00 after BOJ rate decision
  JPY Action Bias: EURJPY and CADJPY Emerge as Extremely Bullish Pairs to Watch
  FxWirePro: EUR/AUD regains upwards momentum but unable to hold above 50%fib level
  NZDJPY Bullish Rebound: Buy Dips as EMAs Align for 97 Target
  AUD/JPY Slips Below 112 as BOJ Intervention Sparks Bearish Momentum: Sell the Rallies
  FxWirePro: AUD/USD dips below lower range, bearish bias increases
  FxWirePro: AUD/USD gains some ground but outlook is bearish
  FxWirePro- Woodies pivot (Major)


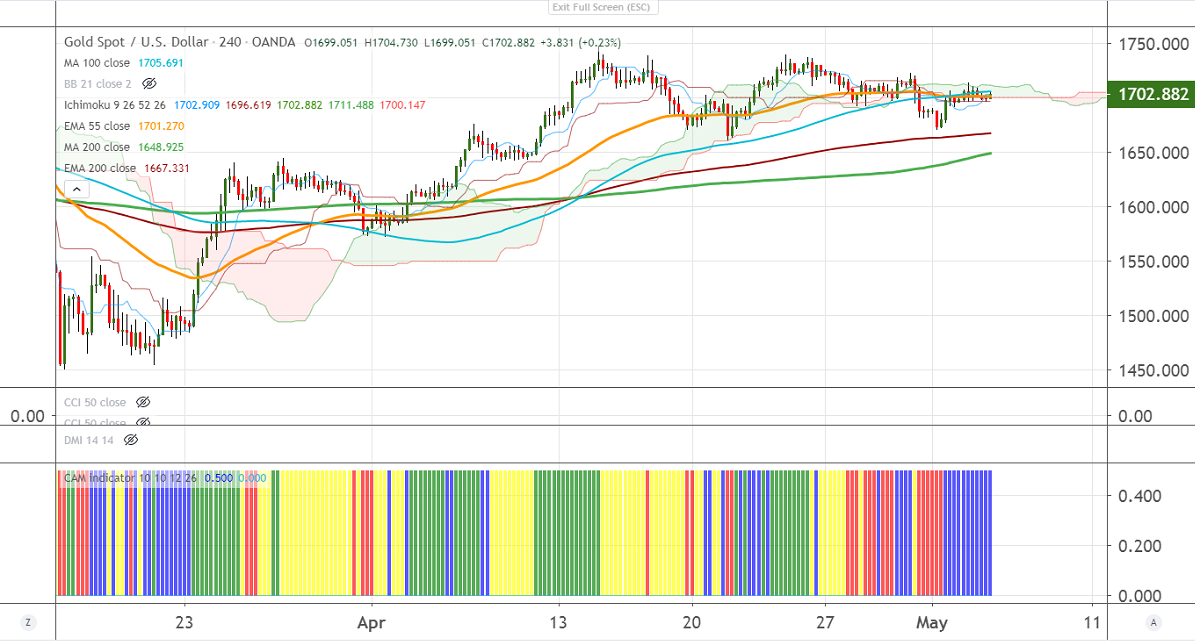
Ichimoku Analysis (4-hours Chart)
Tenken-Sen- $1702
Kijun-Sen- $1696.61
Gold is trading in a narrow range between $1661 and $1747 for past 2-weeks. The minor recovery came after hitting a low of $1670 on weaker than expected US economic data and renewed US-China trade war tension. Markets eye US ISM services data which is to be released today for further direction.
On the flip side, the near term significant support is around $1660 and any violation below will drag the gold down till $1631/$1600.
The immediate resistance is around $1740, any indicative break beyond targets $1760/$1799.
It is good to sell on rallies around $1718-20 with SL around $1740 for the TP of $1660.


