
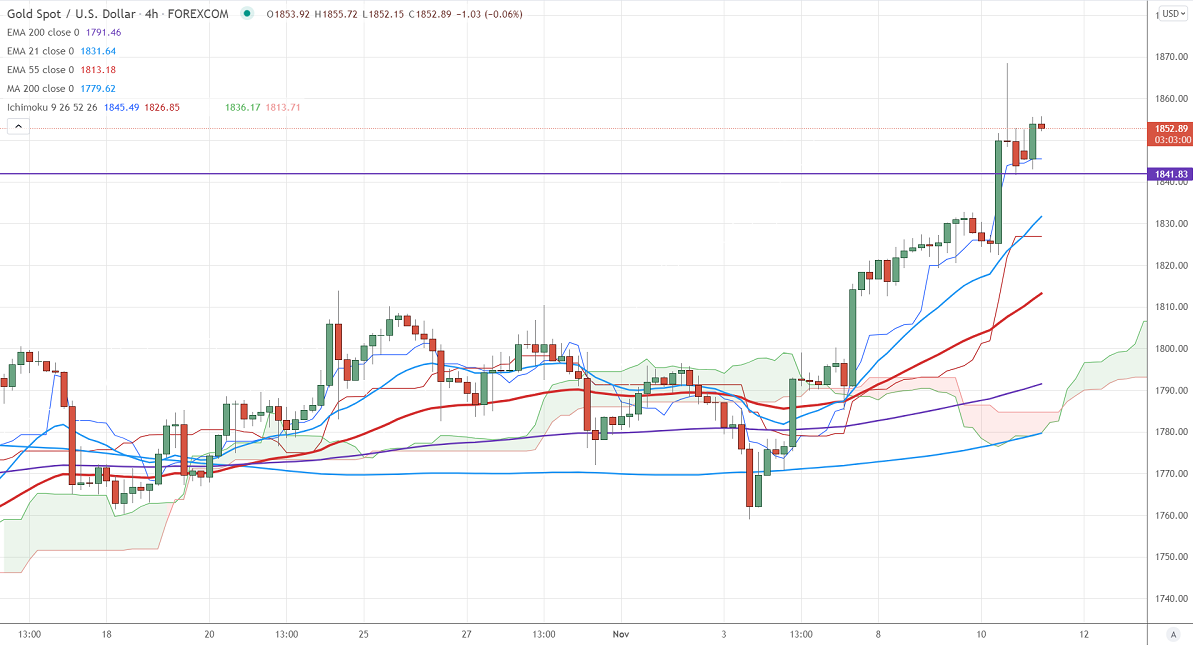
Ichimoku analysis (4-hour chart)
Tenken-Sen- $1845.49
Kijun-Sen- $1826.85
Gold surged slightly after upbeat US CPI data. It rose 0.9% in October compared to a forecast of 0.90% The 12-month inflation surged to 6.2%, the biggest gain since 1990. The US dollar index gained sharply and hits one month high after inflation data. Any close above 95 confirms further bullishness. The US treasury yields regained more than 10%. Gold hits a high of $1868 and is currently trading around $1851.80.
Factors to watch for gold price action-
Global stock market- Slightly bullish (negative for gold)
US dollar index –Bullish (Negative for gold)
US10-year bond yield- Bullish (negative for gold)
Technical:
It faces strong support at $1800 violation below targets $1780/$1760/$1750$1740. Significant trend continuation only below $1675. The yellow metal is facing resistance at $1835, any break above will take the yellow metal to $1860. The major bullish trend after it breaks $1835.
It is good to sell on rallies around $1859-60 with SL around $1870 for TP of $1802.


