
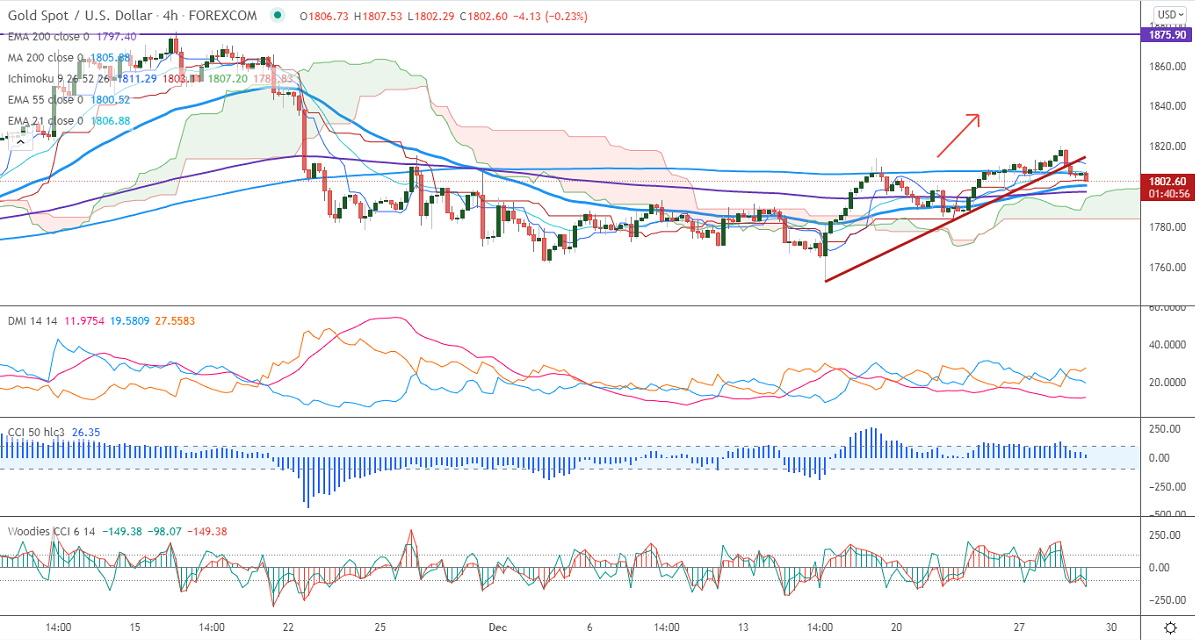
Ichimoku analysis (4-hours chart)
Tenken-Sen- $1812.20
Kijun-Sen- $1803.11
Gold declined once again after a jump above significant resistance of $1815.The overall trend of gold is neutral on holiday mood. The increases in Omicron coronavirus cases and declining US treasury yields are preventing the yellow metal from further sell-off. The US dollar index is holding above 96 levels in hopes of a rate hike by the Fed. It hits an intraday low of $1803.66 and is currently trading around $1803.61.
Factors to watch for gold price action-
Global stock market- Bullish (Negative for gold)
US dollar index –Bearish (positive for gold)
US10-year bond yield- bearish (positive for gold)
Technical:
It faces strong support at $1800, violation below targets $1770/$1750/$1740/$1700.Significant trend continuation only below $1675. The yellow metal facing strong resistance $1820, any violation above will take to the next level $1835/$1860/$1900 is possible.
It is good to buy on dips around $1800 with SL around $1790 for TP of $1835.


