


 Energy Sector Outlook 2025: AI's Role and Market Dynamics
  Moldova Criticizes Russia Amid Transdniestria Energy Crisis
  Stock Futures Dip as Investors Await Key Payrolls Data
  China's Refining Industry Faces Major Shakeup Amid Challenges
  Fed May Resume Rate Hikes: BofA Analysts Outline Key Scenarios
  US Gas Market Poised for Supercycle: Bernstein Analysts
  Gold Prices Slide as Rate Cut Prospects Diminish; Copper Gains on China Stimulus Hopes
  UBS Projects Mixed Market Outlook for 2025 Amid Trump Policy Uncertainty
  S&P 500 Relies on Tech for Growth in Q4 2024, Says Barclays
  Global Markets React to Strong U.S. Jobs Data and Rising Yields
  UBS Predicts Potential Fed Rate Cut Amid Strong US Economic Data
  US Futures Rise as Investors Eye Earnings, Inflation Data, and Wildfire Impacts
  Geopolitical Shocks That Could Reshape Financial Markets in 2025
  Mexico's Undervalued Equity Market Offers Long-Term Investment Potential
  China’s Growth Faces Structural Challenges Amid Doubts Over Data
  Oil Prices Dip Slightly Amid Focus on Russian Sanctions and U.S. Inflation Data
  Lithium Market Poised for Recovery Amid Supply Cuts and Rising Demand


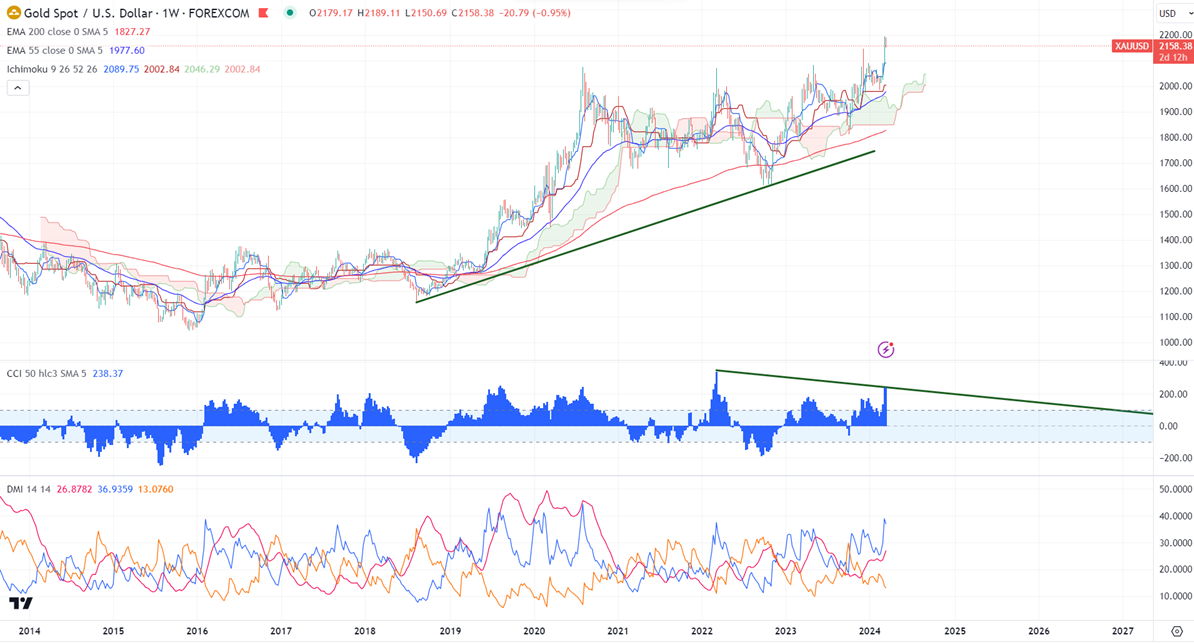
Gold -
Ichimoku Analysis (Weekly chart)
Tenken-Sen- $2089.75
Kijun-Sen- $2002.84
Gold lost its shine after mixed US CPI data. It rose 0.40% m/m in Feb, compared to a forecast of 0.30%. The consumer price index came in at 3.2% y/y, slightly above the forecast of 3.1%. The yellow metal hit a low of $2150 yesterday and is currently trading around $2158.32.
Chart pattern- Bearish divergence (CCI(50) weekly chart)
According to the CME Fed watch tool, the probability of a no-rate cut in Mar decreased to 99% from 96% a week ago.
US dollar index- Bearish. Minor support around 102.30/101.40. The near-term resistance is 103.20/104.
Factors to watch for gold price action-
Global stock market- Bullish (negative for gold)
US dollar index - Bearish (Bullish for gold)
US10-year bond yield- Bullish (negative for gold)
Technical:
The near–term support is around $2150, a break below targets of $2145/$2120/$2100. The yellow metal faces minor resistance around $2200 and a breach above will take it to the next level of $2225/$2250.
It is good to sell on rallies around $2168-70 with SL around $2200 for TP of $2100.


