


 FxWirePro- Major Crypto levels and bias summary
  FxWirePro- Woodies pivot (Major)
  FxWirePro: USD/ZAR uptrend loses steam, remains on bullish path
  FxWirePro: GBP/NZD downside pressure builds, key support levels in focus
  AUDJPY Extends Four-Day Rally on Yen Weakness: Bullish Dip-Buy Eyes 117-118
  FxWirePro:USD/JPY hovers near a four-decade low
  NZDJPY Bullish Dip-Buy Setup: 93.60 Support Unlocks Path to 97
  GBPJPY Slips After Sterling Weakness, Bears Eye 216
  BTC, ETH, SOL, XRP, and BNB: Major Crypto Pairs Stay Neutral
  FxWirePro: EUR/NZD downside pressure builds, key support level in focus
  AUDJPY Action Bias: Bullish Dip-Buy Setup Despite Flat Neutral Bias
  Major Pair Action Bias: Bullish Pairs to Watch Out For
  FxWirePro :USD/JPY eases slightly, remains on bullish path
  FxWirePro: USD/CAD positions for another climb, eyes 1.4150 level
  NZDJPY Action Bias: Bullish Dip-Buying Opportunity on Broad Yen Weakness
  FxWirePro: AUD/USD gains on Iran-US truce hopes, risk rally


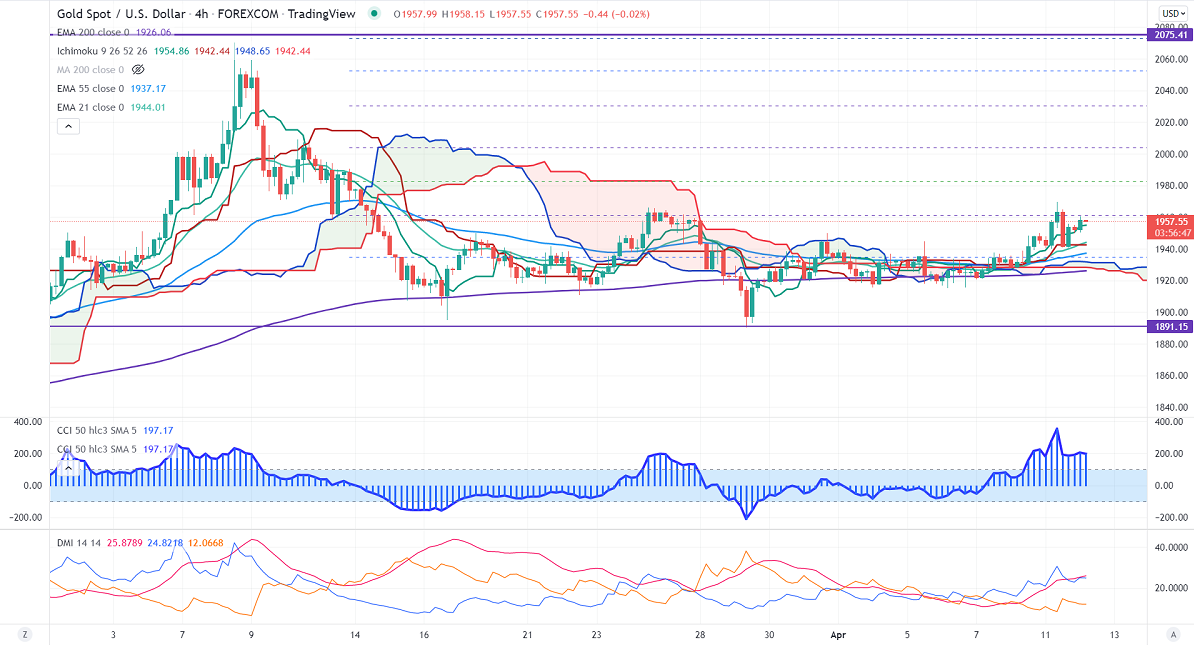
Ichimoku Analysis (4-hour chart)
Tenken-Sen- $1954.26
Kijun-Sen- $1942.44
Gold breaks significant resistance at $1950 after long consolidation despite a surge in US bond yields. US dollar index regained above 100 levels ahead of US CPI data. Any daily close above 100 confirms further bullishness. US 10-year yield jumped sharply and hits the highest level in three years in hopes of an aggressive rate hike by the Fed. The yellow metal hits a high of $1969.66 and is currently trading around $1959.64.
Factors to watch for gold price action-
Global stock market- weak (Positive for gold)
US dollar index –Bullish (negative for gold)
US10-year bond yield- Bullish (negative for gold)
Technical:
The near–term support is around $1940 (yesterday's low), breach below confirms the intraday bearish trend. A dip to $1925/$1910/$1900/$1890. Significant reversal only below $1890. The yellow metal faces strong resistance of $1961 (38.2% fib), any breach above will take to the next level $1982/$2000/$2020.
It is good to sell on rallies around $1960-61 with SL around $1975 for TP of $1850.


