


 FxWirePro- Woodies pivot (Major)
  JPY Action Bias: USDJPY, EURJPY, and CADJPY Emerge as Top Extremely Bullish Picks
  FxWirePro: EUR/NZD firms after ECB holds rates steady at 2.25%
  EUR/USD Slides After ECB Hold, Bearish Technicals Favor Rally Fades
  Major Pairs Action Bias: USDCHF Emerges Extremely Bullish as EURUSD and GBPUSD Turn Deeply Bearish
  FxWirePro: USD/CNY edges higher but bulls lack punch
  FxWirePro: GBP/NZD gains some ground but outlook is bearish
  FxWirePro: USD/ZAR retreats slightly but bias is bullish
  FxWirePro: EUR/AUD neutral in the near term, scope for downward resumption
  FxWirePro: AUD/USD uptrend loses steam, remains on bearish path
  FxWirePro: GBP/AUD under pressure as pound continues to weaken
  FxWirePro- Major Crypto levels and bias summary
  FxWirePro- Woodies pivot (Major)
  FxWirePro: GBP/USD downtrend loses steam but outlook still bearish
  FxWirePro:USD/JPY hovers near a four-decade low
  Crypto Bias Report: Trend Signals and Top Bullish Picks


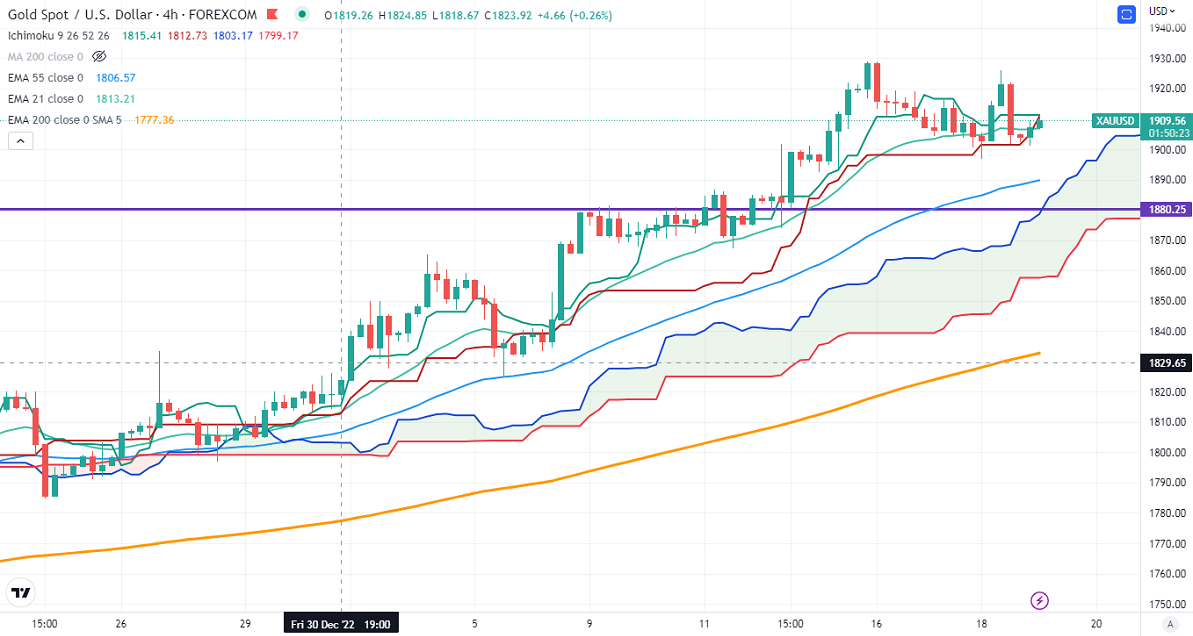
Ichimoku Analysis (4-Hour chart)
Tenken-Sen- $1911.32
Kijun-Sen- $1904.80
Gold has traded in a narrow range between $1896 and $1925.95 for the past two days despite weak US treasury yields. The US Producer price index declined 0.50% last month, below the estimate of 0.10%. The YoY PPI came at 6.2% vs. an estimate of 6.8%. US retail sales came at -1.1% last month, the biggest drop since Dec 2021. Gold hits an intraday high of $1911 and is currently trading around $1909.55.
US dollar index- Bearish. Minor support around 101.50/100. The near-term resistance is 103.50/104.50.
According to the CME Fed watch tool, the probability of a 25 bpbs rate hike in Feb rose to 96.40% from 76.70% a week ago.
The US 10-year yield pared most of its gains after hitting a high of 3.585%. Any break and close below 3.26% confirm minor bearishness. The yield spread between 10 and 2-year widened to -72 basis points from -46.9 bpbs.
Factors to watch for gold price action-
Global stock market- bearish (bullish for gold)
US dollar index – Bearish (positive for gold)
US10-year bond yield- Bearish (Positive for gold)
Technical:
The near–term support is around $1890, a break below targets of $1865/$1825.The yellow metal faces minor resistance around $1935, and a breach above will take it to the next level of $1950/$1969.
It is good to sell on rallies around $1918-20 with SL around $1935 for TP of $1860/$1825.


