


 FxWirePro: USD/ZAR surges as rand slumps after SARB rate hold surprise
  FxWirePro: USD/ZAR retreats slightly but bias is bullish
  FxWirePro: USD/CAD positions for another climb, eyes 1.4150 level
  FxWirePro: GBP/USD slips as middle east tensions and oil surge pressure pound
  FxWirePro: GBP/AUD under pressure as pound continues to weaken
  FxWirePro- Major Crypto levels and bias summary
  FxWirePro- Woodies pivot (Major)
  FxWirePro:USD/JPY hovers near a four-decade low
  FxWirePro: GBP/NZD gains some ground but outlook is bearish
  FxWirePro: GBP/USD downtrend loses steam but outlook still bearish
  FxWirePro: GBP/NZD downside pressure builds, key support levels in focus
  FxWirePro: AUD/USD uptrend loses steam, remains on bearish path
  FxWirePro- Woodies pivot (Major)
  NZDJPY Bullish Dip-Buy Setup: 93.60 Support Unlocks Path to 97
  BTC, ETH, SOL, XRP, and BNB: Major Crypto Pairs Stay Neutral
  EUR/USD Slides After ECB Hold, Bearish Technicals Favor Rally Fades


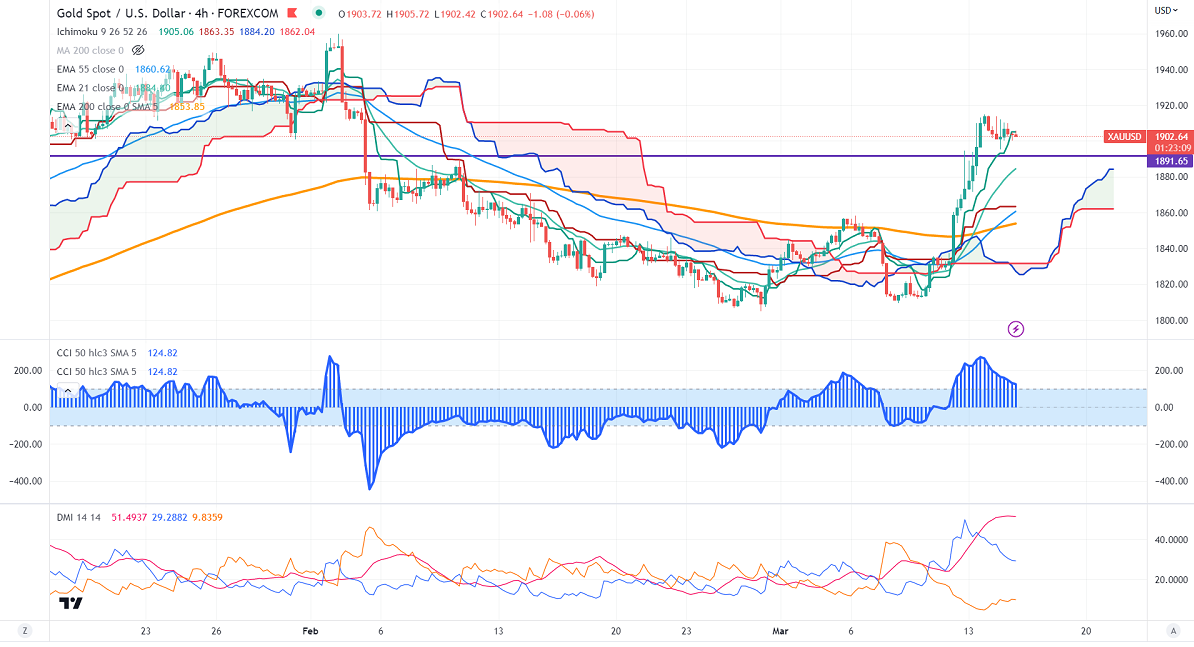
Ichimoku Analysis (4-Hour chart)
Tenken-Sen- $1905.06
Kijun-Sen- $1863.35
Gold prices surged after mixed US inflation. US CPI rose 0.40% last month in line with the estimate, below 0.50% the previous month. The yearly CPI declined to 6% in Feb, the smallest annual gain since Sep 2021. Gold hit a high of $1914.50 and is currently trading around $1903.
Major economic data for the day
Mar 15th, 2023 US PPI m/m (12:30 PM GMT)
US retail sales m/m (12:30 GMT)
US Empire state manufacturing Index ( 12:30 pm GMT)
US dollar index-Bearish. Minor support around 103.50/102.50. The near-term resistance is 104.30/105.
According to the CME Fed watch tool, the probability of a 25 bpbs rate hike in Mar increased to 81.2% from 30.2% a week ago.
The US 10-year yield recovered more than 3.5% after a major sell-off. The US 10 and 2-year spread narrowed to 63% from -107%.
Factors to watch for gold price action-
Global stock market- bearish (Positive for gold)
US dollar index - Bearish (positive for gold)
US10-year bond yield- Bearish (positive for gold)
Technical:
The near–term support is around $1880, a break below targets of $1860/$1840.The yellow metal faces minor resistance around $1920 and a breach above will take it to the next level of $1959/$2000.
It is good to buy on dips around $1870 with SL around $1850 for TP of $1920/$1959.


