


 FxWirePro: AUD/USD uptrend loses steam, remains on bearish path
  FxWirePro: EUR/NZD firms after ECB holds rates steady at 2.25%
  Major Pairs Bias: USDCHF Bullish While GBPUSD Turns Bearish
  FxWirePro: GBP/USD slips as middle east tensions and oil surge pressure pound
  FxWirePro: EUR/AUD neutral in the near term, scope for downward resumption
  FxWirePro: GBP/NZD gains some ground but outlook is bearish
  FxWirePro- Major Crypto levels and bias summary
  JPY Strength Alert: USDJPY, AUDJPY, EURJPY and CADJPY Turn Extremely Bullish
  FxWirePro: GBP/USD downtrend loses steam but outlook still bearish
  EUR/USD Slides After ECB Hold, Bearish Technicals Favor Rally Fades
  FxWirePro- Woodies pivot (Major)
  FxWirePro: USD/CNY edges higher but bulls lack punch
  FxWirePro: USD/CAD edges lower but bullish outlook persists
  Major Pairs Action Bias: USDCHF Emerges Extremely Bullish as EURUSD and GBPUSD Turn Deeply Bearish
  FxWirePro- Woodies pivot (Major)
  FxWirePro: USD/ZAR retreats slightly but bias is bullish


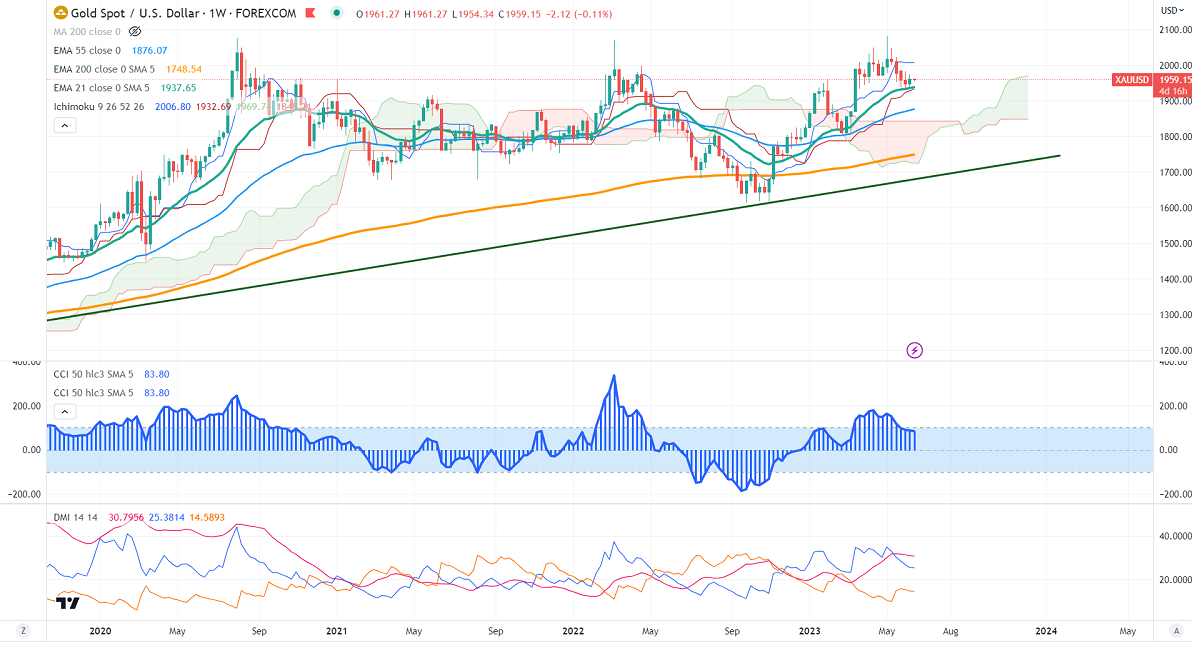
Ichimoku Analysis (weekly chart)
Tenken-Sen- $2006.80
Kijun-Sen- $1927.64
Gold prices formed a triple bottom around $1935, showing a minor pullback. Markets eye US Federal funds rate for further direction. The minor weakness in the US dollar prevents the yellow metal from further sell-off. It hits a high of $1973.50 yesterday and is currently trading around $1957.07.
US dollar index- Neutral. Minor support around 103.20/102.80. The near-term resistance is 103.85/104.40.
Major economic data for the week
Jun 13th, US CPI (12:30 PM)
Jun 14th, US PPI (12:30 PM)
Jun 15th, ECB monetary policy (12:15 PM GMT)
Core retail sales m/m and Empire State Manufacturing Index (12:30 PM GMT)
According to the CME Fed watch tool, the probability of a no-rate hike in June increased to 73.6% from 70.1% a day ago.
The US 10-year yield traded in a narrow range between 3.65% and 3.82% for the past week. The US 10 and 2-year spread widened to -86% from -71.10%.
Factors to watch for gold price action-
Global stock market- bullish (negative for gold)
US dollar index - Mixed (neutral for gold)
US10-year bond yield- Bullish (Bearish for gold)
Technical:
The near–term support is around $1935, a break below targets of $1920/$1900.The yellow metal faces minor resistance around $1965, and a breach above will take it to the next level of $1980/$2000/$2020/$2040/$2070/$2100/$2150.
It is good to sell on rallies around $1970 with SL around $1980 for TP of $1920/$1900.


