


 EUR/USD Slides After ECB Hold, Bearish Technicals Favor Rally Fades
  Crypto Bias Report: Trend Signals and Top Bullish Picks
  FxWirePro:USD/JPY hovers near a four-decade low
  JPY Strength Alert: USDJPY, AUDJPY, EURJPY and CADJPY Turn Extremely Bullish
  NZDJPY Dips Create Fresh Buy Opportunity as Key Support Holds
  FxWirePro: GBP/NZD gains some ground but outlook is bearish
  NZDJPY Bullish Dip-Buy Setup: 93.60 Support Unlocks Path to 97
  AUDJPY Extends Four-Day Rally as Yen Weakness Fuels Fresh Buying Opportunity
  FxWirePro: EUR/NZD firms after ECB holds rates steady at 2.25%
  BTC, ETH, SOL, XRP, and BNB: Major Crypto Pairs Stay Neutral
  FxWirePro: USD/ZAR retreats slightly but bias is bullish
  FxWirePro: EUR/ AUD downtrend loses steam, remains on bearish path
  FxWirePro: GBP/AUD bears maintain upper hand
  JPY Action Bias: USDJPY, EURJPY, and CADJPY Emerge as Top Extremely Bullish Picks
  FxWirePro: USD/CAD edges lower but bullish outlook persists
  FxWirePro: AUD/USD rallies on jobs surge, heads to test key resistance


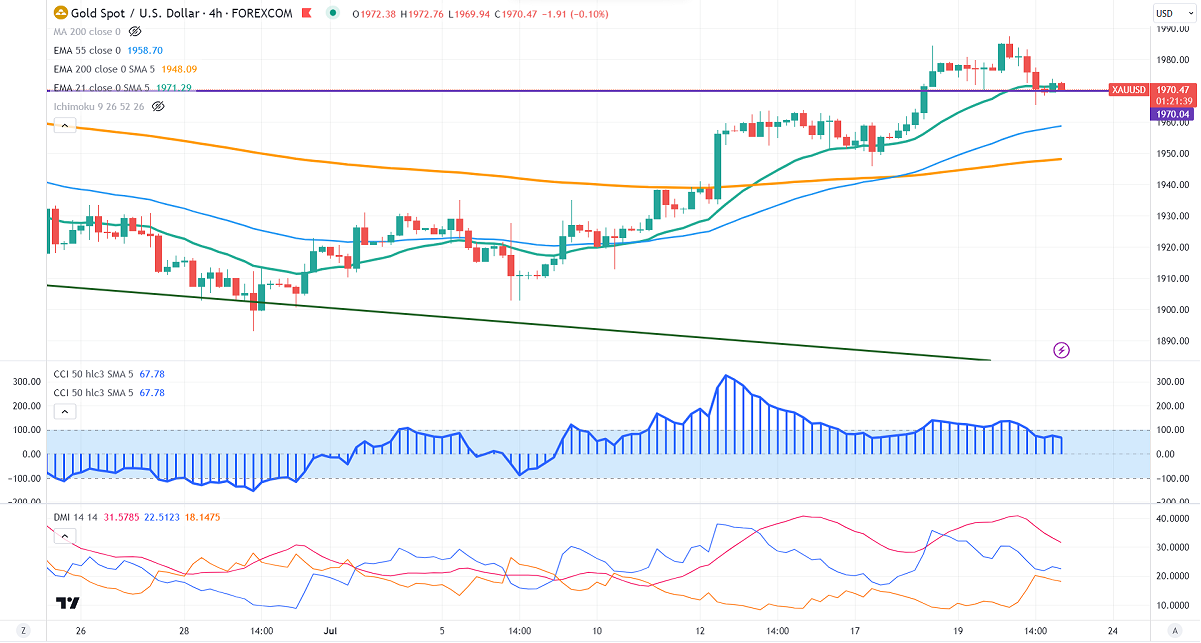
Ichimoku Analysis (4- Hour chart)
Tenken-Sen- $1976.48
Kijun-Sen- $1966.70
Gold prices pared some of their gains after mixed US economic data. It hits a low of $1965 and currently trading around $1970.19.
The number of people who have filed for unemployment benefits declined to 228000 in the week ending July 15th, compared to a forecast of 242K. US Philly fed manufacturing index dropped to -13.50 vs.-10 expected.
US dollar index- weak. Minor support around 99.50/98. The near-term resistance is 100.60/102.
According to the CME Fed watch tool, the probability of a 25 bpbs rate hike in July increased to 99.80% from 93% a week ago.
The US 10-year yield showed a minor pullback on mixed US economic data. The US 10 and 2-year spread narrowed to -98.6% from -110%.
Factors to watch for gold price action-
Global stock market- bullish (negative for gold)
US dollar index - Bearish (Positive for gold)
US10-year bond yield- Bearish (positive for gold)
Technical:
The near–term support is around $1950, a break below targets of $1945/1930. The yellow metal faces minor resistance around $1965, and a breach above will take it to the next level of $1980/$2000.
It is good to buy on dips around $1960 with SL around $1950 for TP of $1990/$2000.


