


 FxWirePro:USD/JPY hovers near a four-decade low
  EUR/USD Slides After ECB Hold, Bearish Technicals Favor Rally Fades
  Crypto Bias Report: Trend Signals and Top Bullish Picks
  NZDJPY Dips Create Fresh Buy Opportunity as Key Support Holds
  JPY Strength Alert: USDJPY, AUDJPY, EURJPY and CADJPY Turn Extremely Bullish
  JPY Action Bias: USDJPY, EURJPY, and CADJPY Emerge as Top Extremely Bullish Picks
  FxWirePro:USD/JPY holds above 163 as intervention fears keep traders on edge
  AUDJPY Extends Four-Day Rally as Yen Weakness Fuels Fresh Buying Opportunity
  FxWirePro- Woodies pivot (Major)
  FxWirePro- Major Crypto levels and bias summary
  FxWirePro: GBP/AUD bears maintain upper hand
  FxWirePro: GBP/NZD gains some upside momentum but still bearish
  NZDJPY Bullish Dip-Buy Setup: 93.60 Support Unlocks Path to 97
  Major Pairs Bias: USDCHF Bullish While GBPUSD Turns Bearish
  FxWirePro: GBP/NZD gains some ground but outlook is bearish
  FxWirePro: USD/ZAR surges as rand slumps after SARB rate hold surprise
  Major Pairs Action Bias: USDCHF Emerges Extremely Bullish as EURUSD and GBPUSD Turn Deeply Bearish


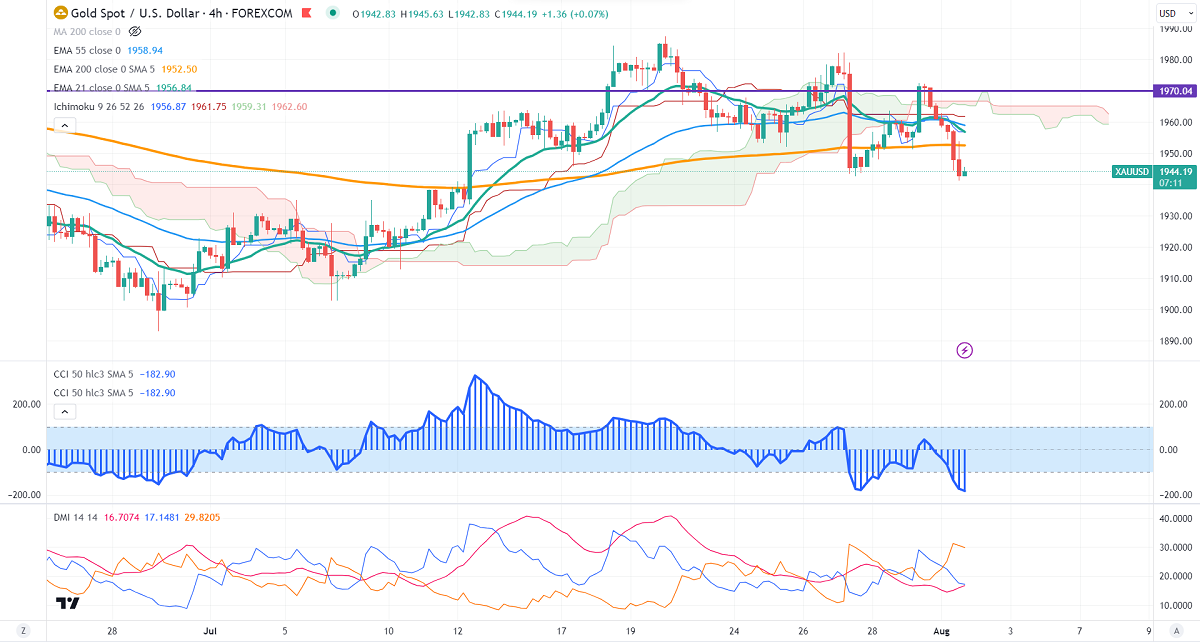
Ichimoku Analysis (4- Hour chart)
Tenken-Sen- $1956.87
Kijun-Sen- $1961.75
Gold showed a massive sell-off on the strong US dollar and surging US bond yields. It hits a low of $1941.30 and is currently trading around $1944.49.
According to the Institute of supply management, the US ISM manufacturing index improved to 46 in Jul, below expectations of 46.80.
Major economic data for the day
Aug 2nd, 2023, US ADP employment data (12:15 pm GMT)
US dollar index- Bullish. Minor support around 100.60/99.50. The near-term resistance is 102.50/103.
According to the CME Fed watch tool, the probability of a no-rate hike in Sep increased to 82.50% from 78.70% a week ago.
The US 10-year yield gained more than 2.5% despite weak US ISM manufacturing PMI. The US 10 and 2-year spread narrowed to -87.10 from -110%.
Factors to watch for gold price action-
Global stock market- bullish (negative for gold)
US dollar index - Bullish (bearish for gold)
US10-year bond yield- Bearish (negative for gold)
Technical:
The near–term support is around $1940, a break below targets of $1930/$1920. The yellow metal faces minor resistance around $1955 and a breach above will take it to the next level of $1965/$1975/$1990.
It is good to sell on rallies around $1955-57 with SL around $1970 for TP of $1900.


